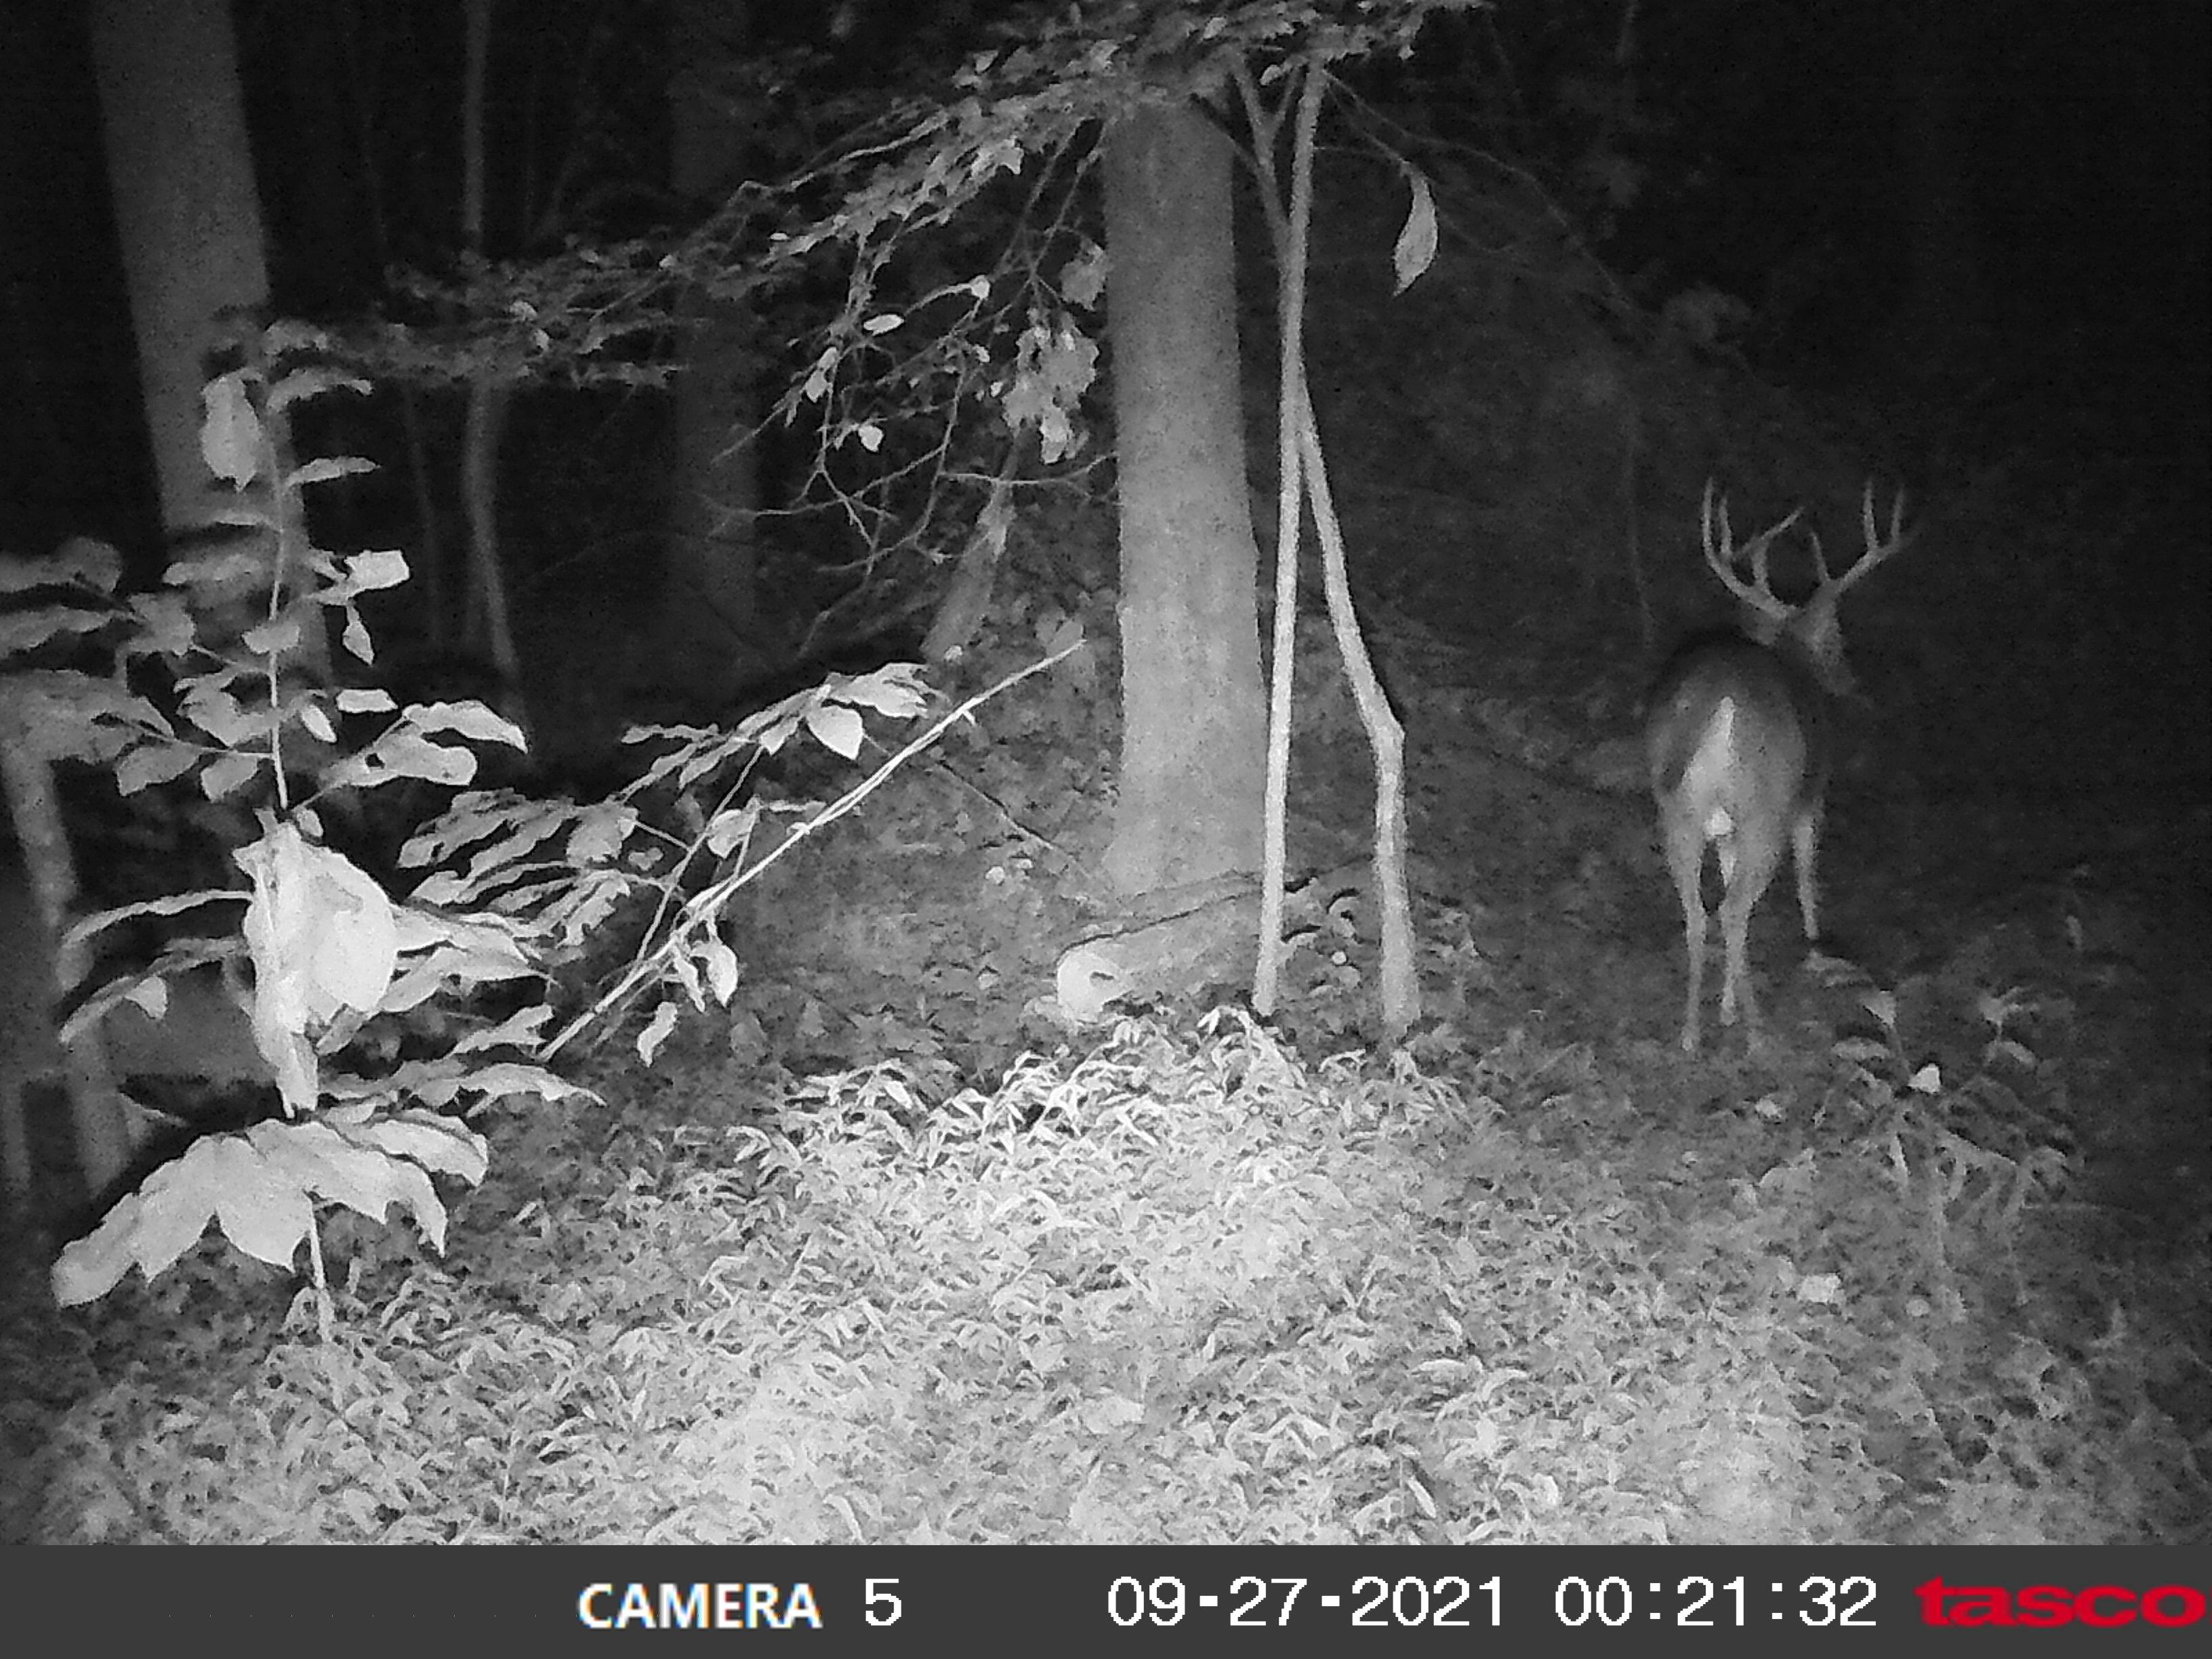
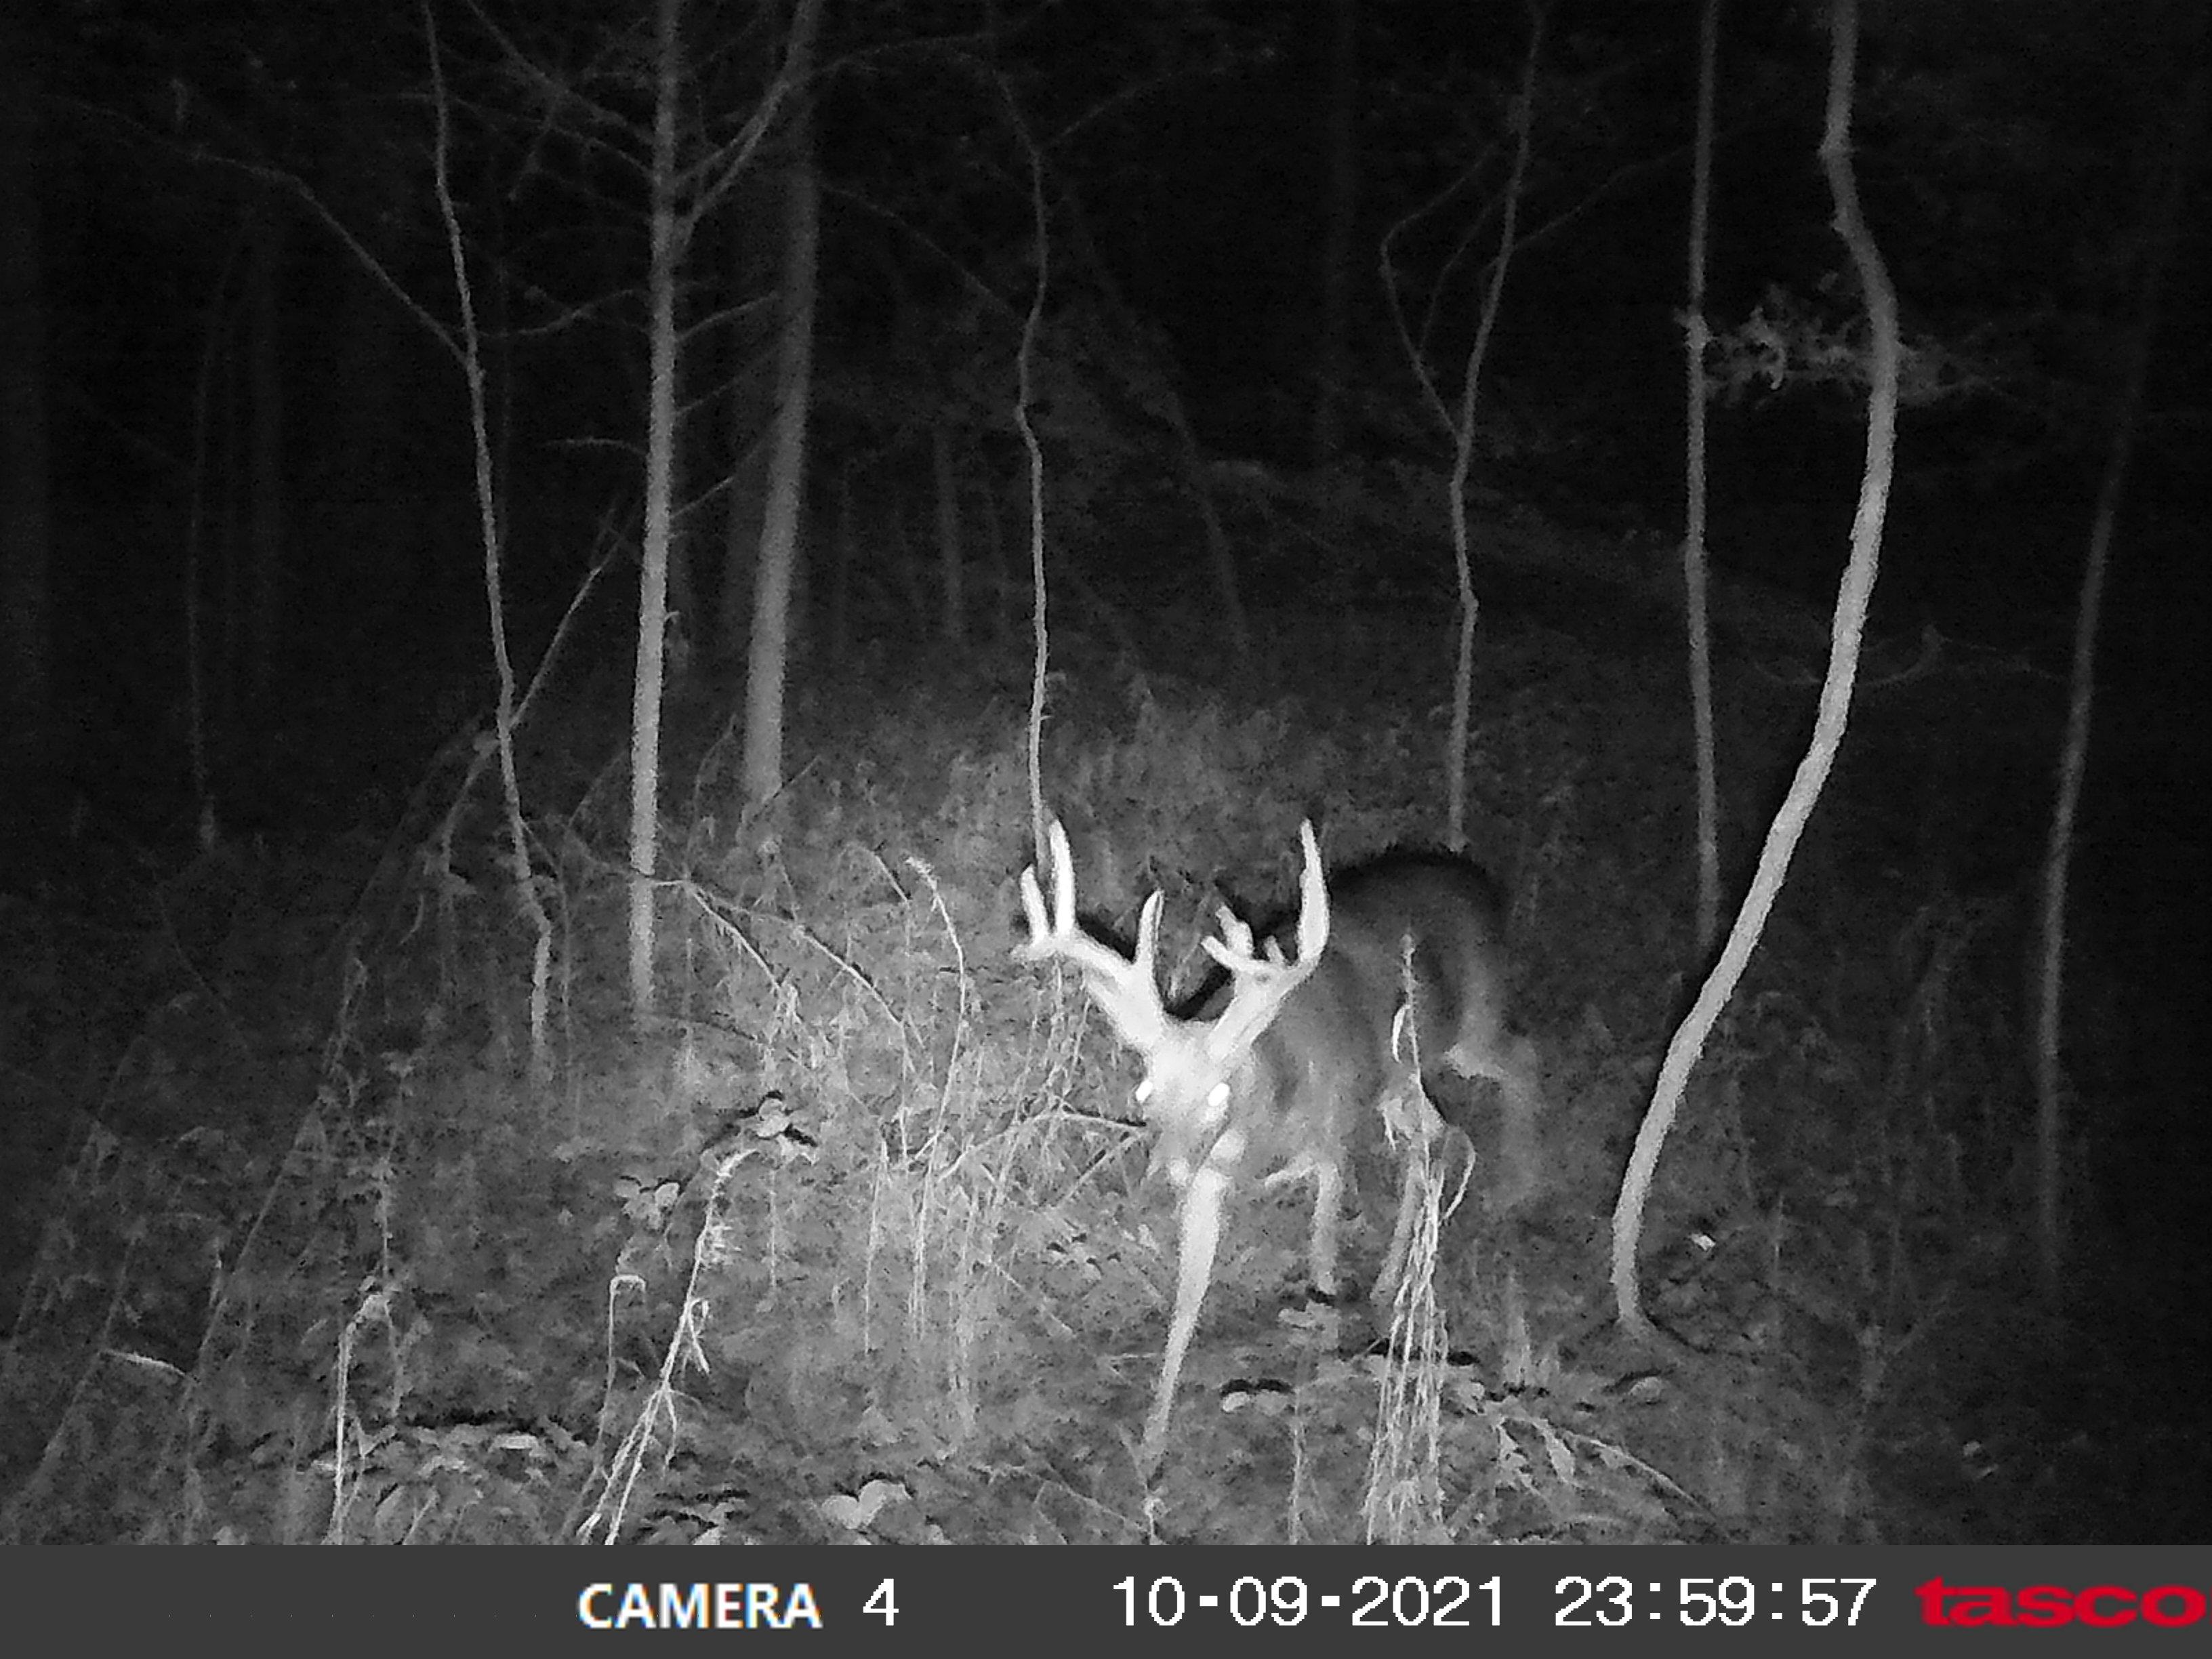
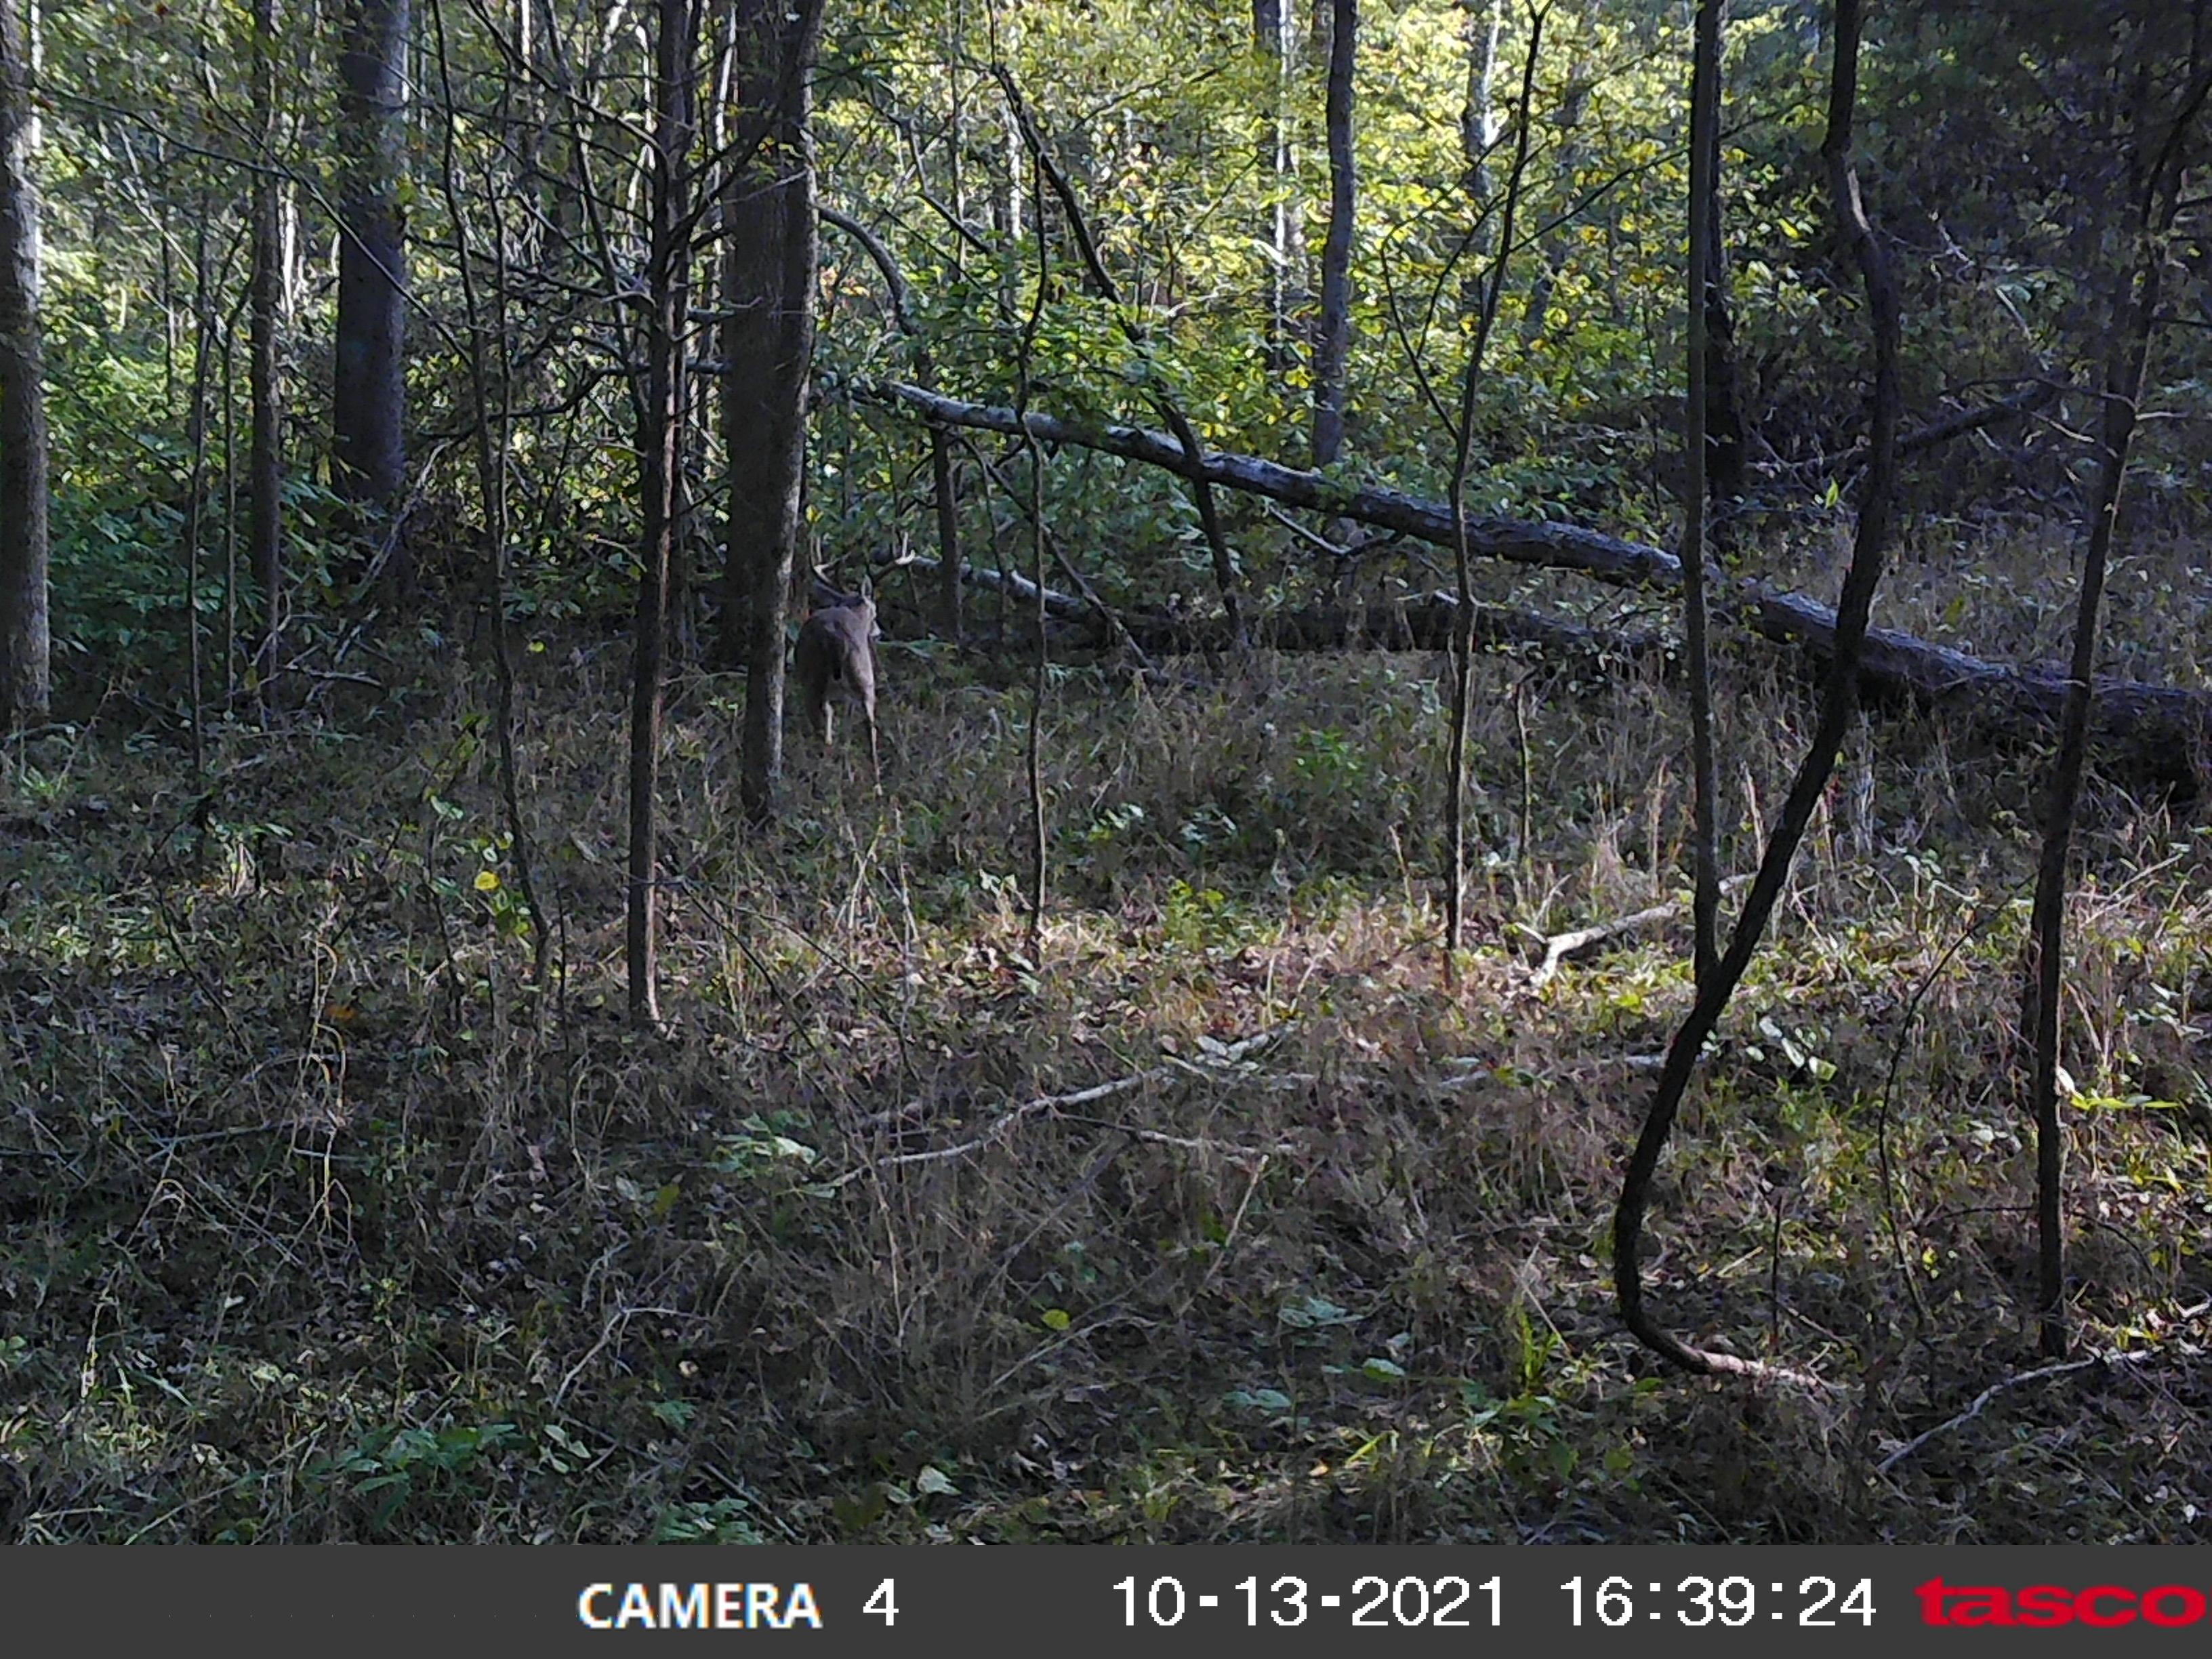
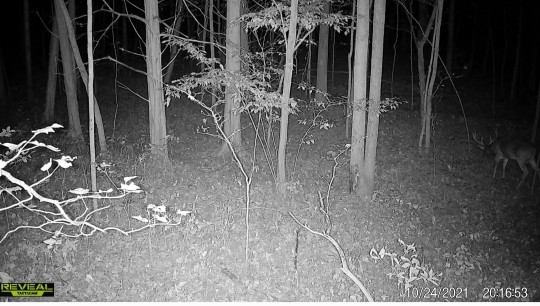
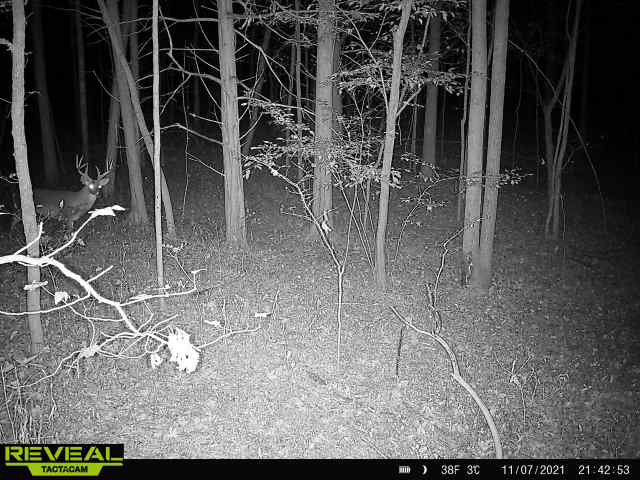
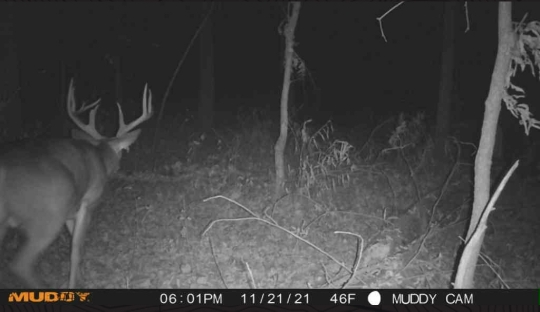
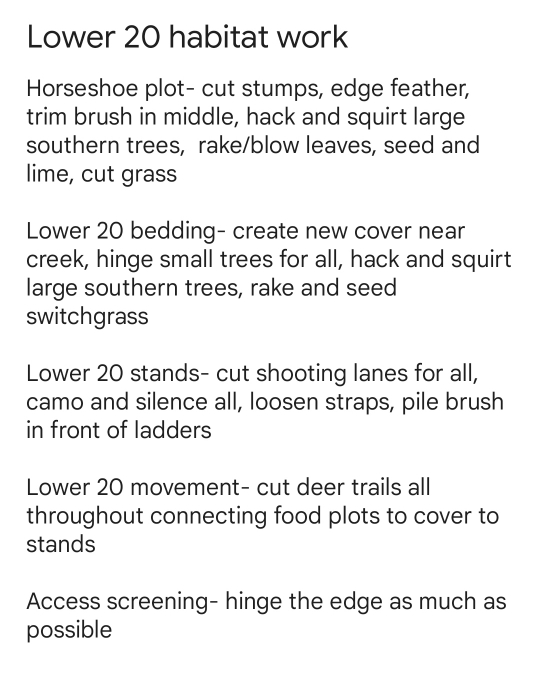
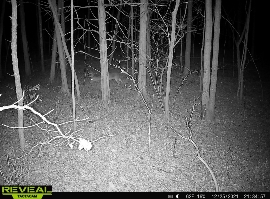
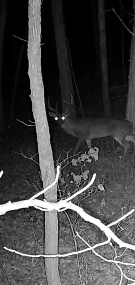
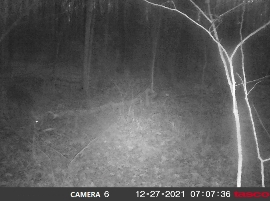
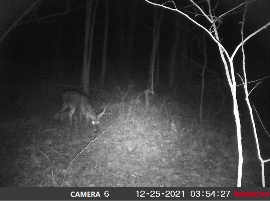
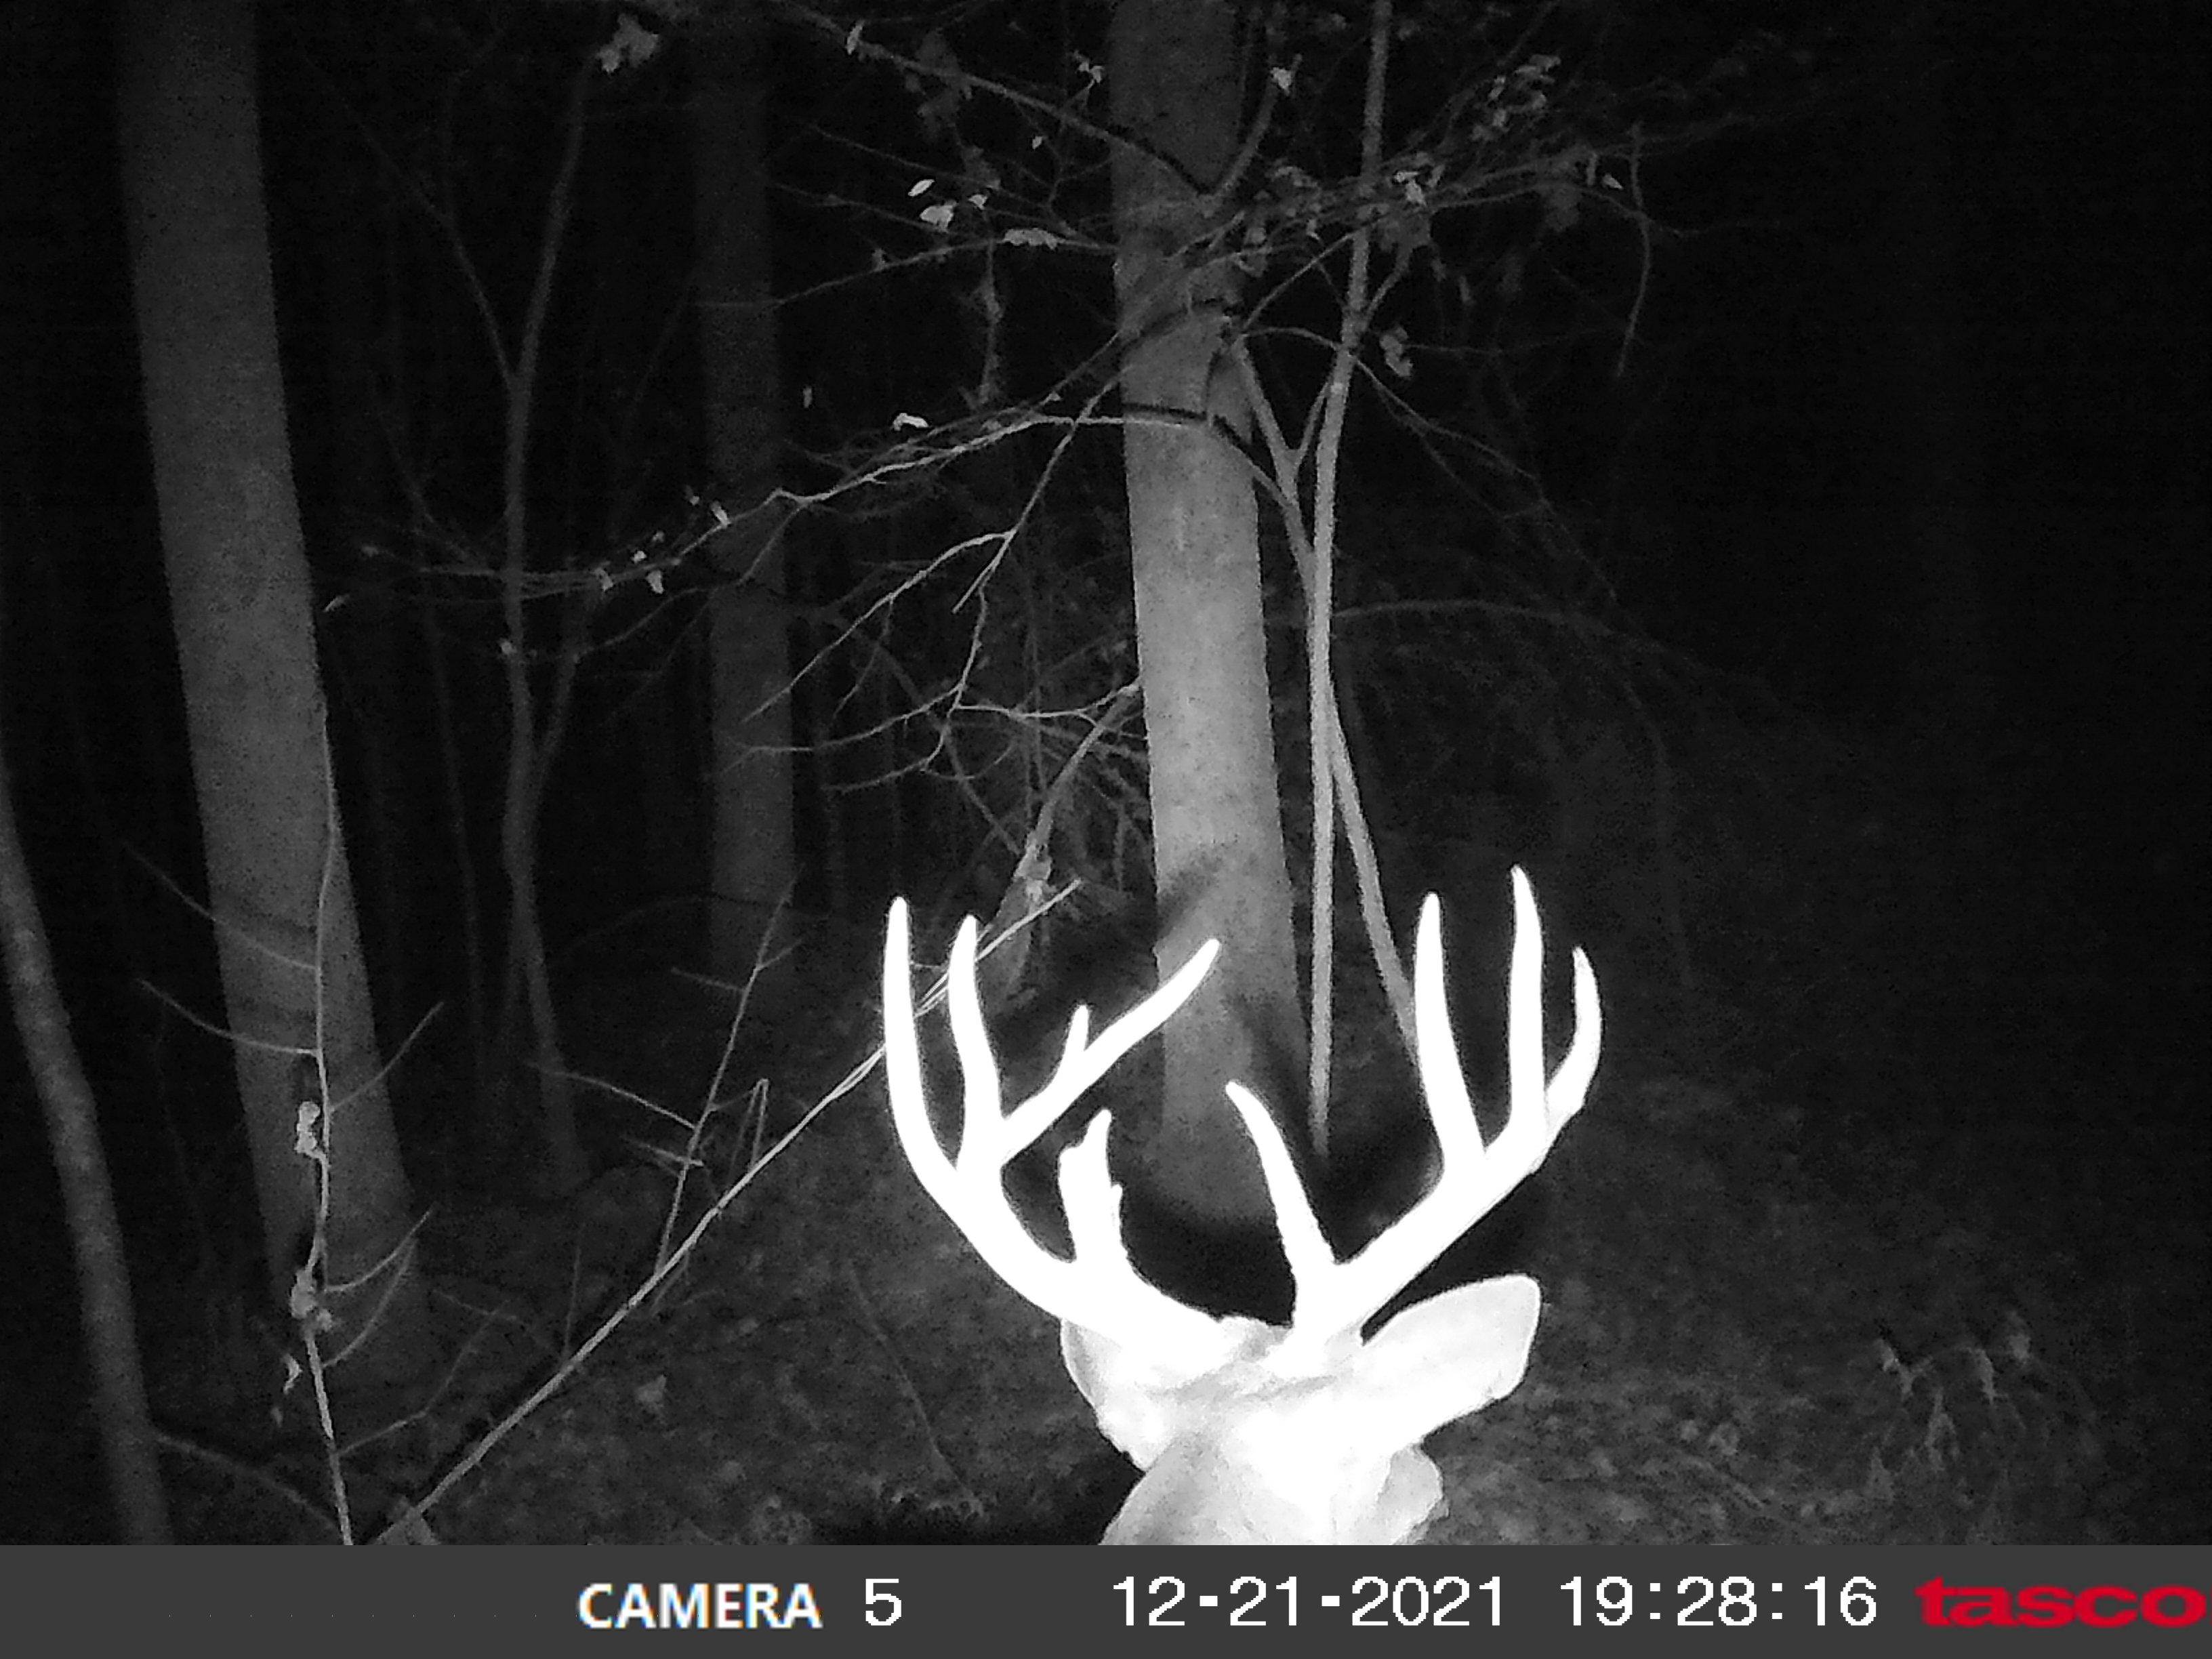
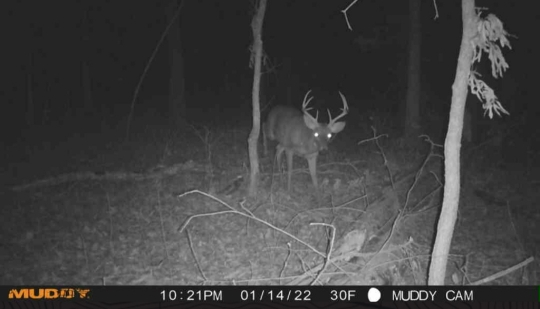
Not sure if anyone else keeps records like this but I would say things are trending in the right direction so far. I hope that continues after this year's improvements and i just wanted to document it on my property tour thread.
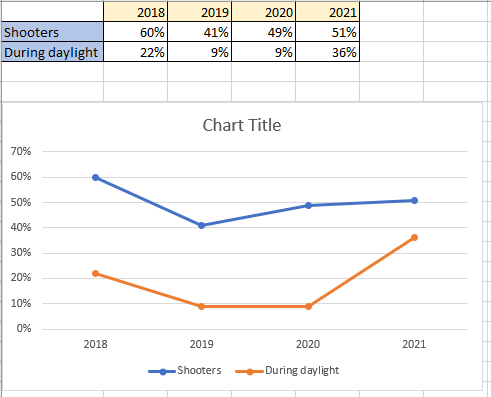
2018 is probably a little bit of an anomaly as it was my first year on the property and I don't think it had been hunted in recent years, so pressure was already low. I mainly hunted the upper 20 since i didnt have good access on the lower 20 at this point. Also, I only had a couple of cameras out, one of which captured 93% of the shooter images and to this day I still get good pics in that spot. 2019 had only minor habitat changes so I think my hunting pressure drove the percentages down. 2020 was a rough year with multiple flooding events during prime chasing/rutting (late Oct into mid Nov), but I still managed to get some good bucks using my improvement areas. 2021 was a dry year and by far the best year for daytime movement of shooters.
Here's how I calculated the data for this chart...
1. Overall camera sightings for bucks during the season
2. Number of shooters (some are maybes if the pictures weren't clear enough, but they were counted in this bucket) during the season
3. Number of shooters during shooting hours
I also have weather data details for each sighting, but did not create a chart for that as there are so many data points.
Sent from my SM-G973U using Tapatalk
