horntagger
Member
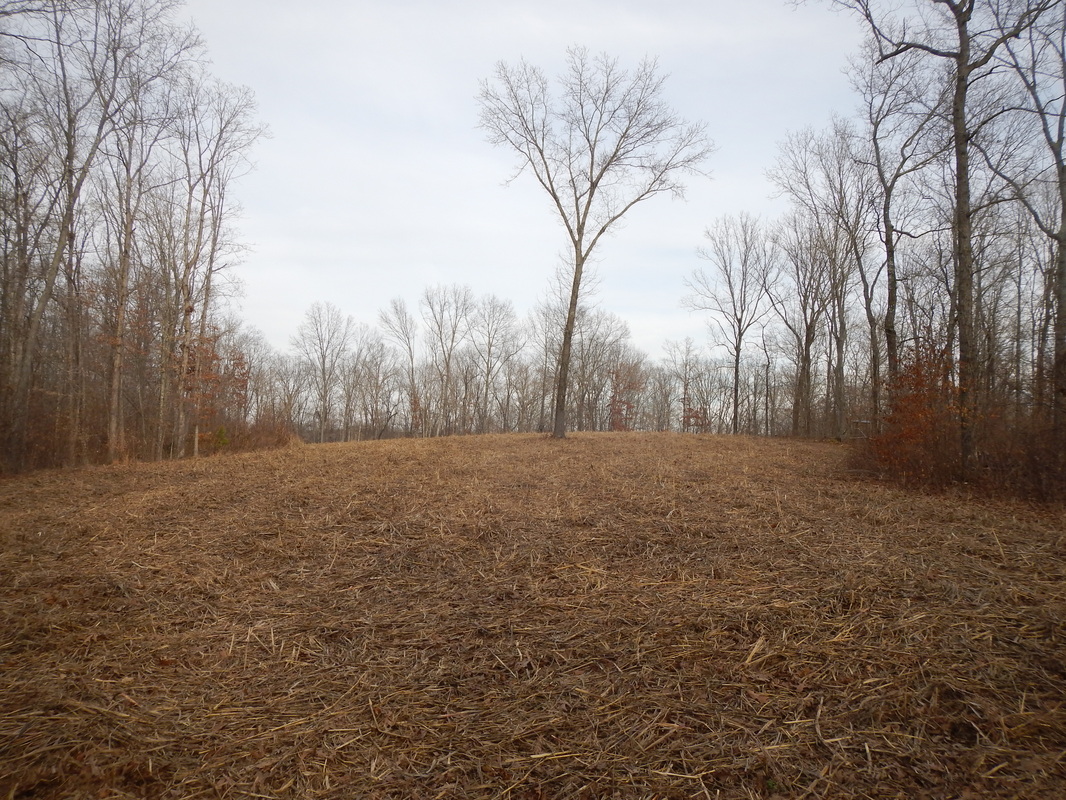
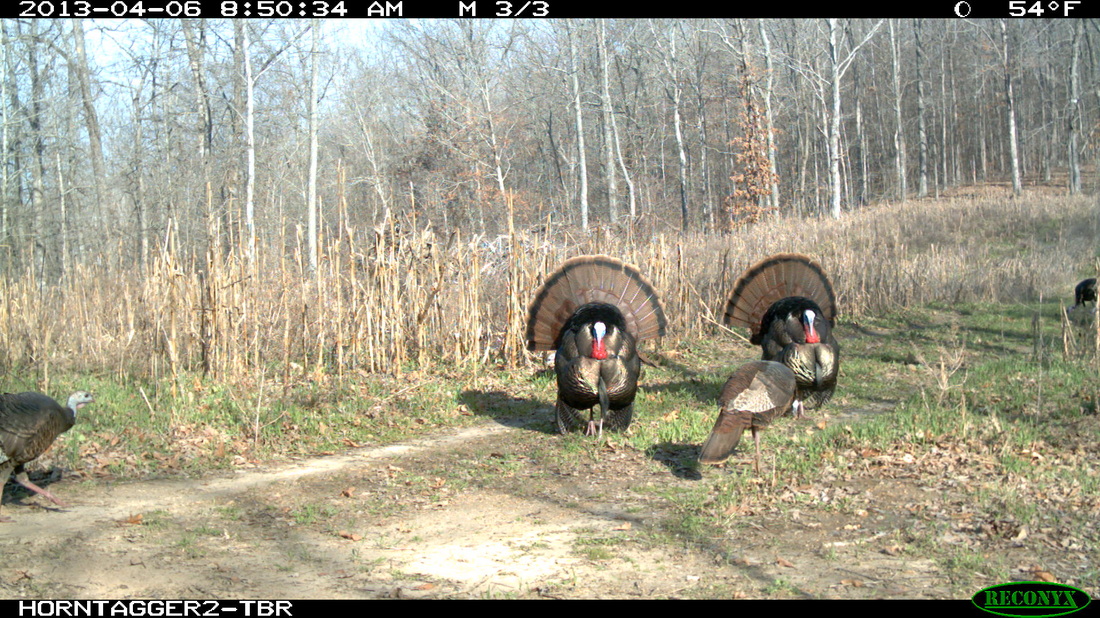
2008 Doze Ground from Oak/Hickory Forest
This makes the 5th Soil Sample over time.
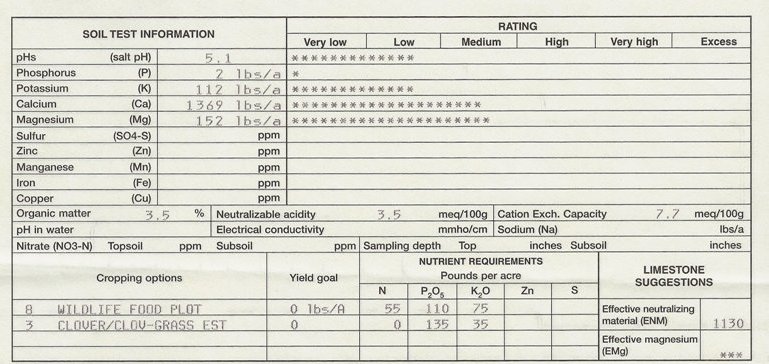
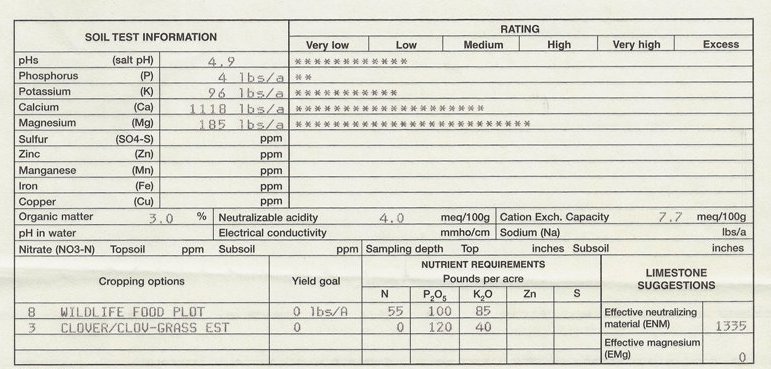
Main Food Plot
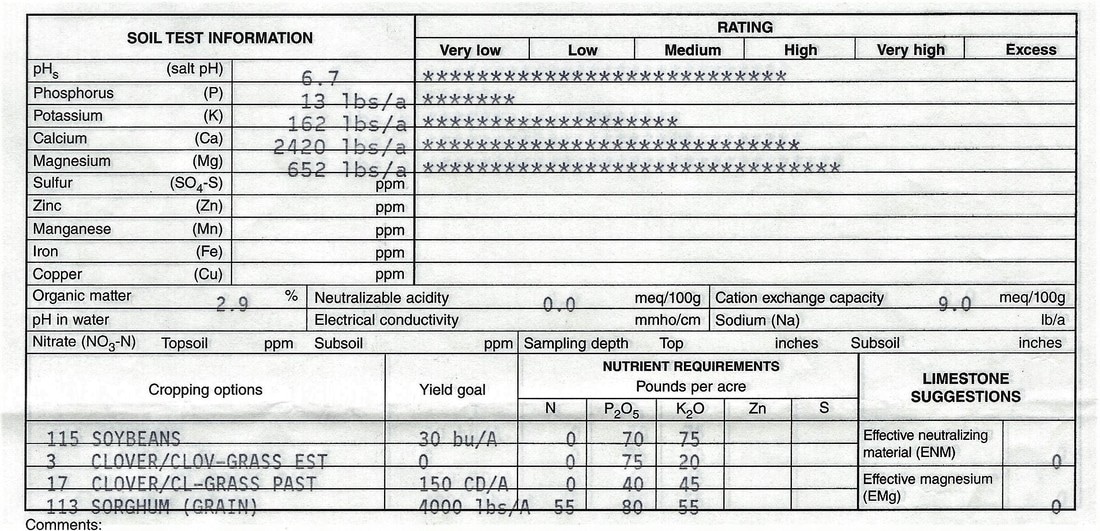
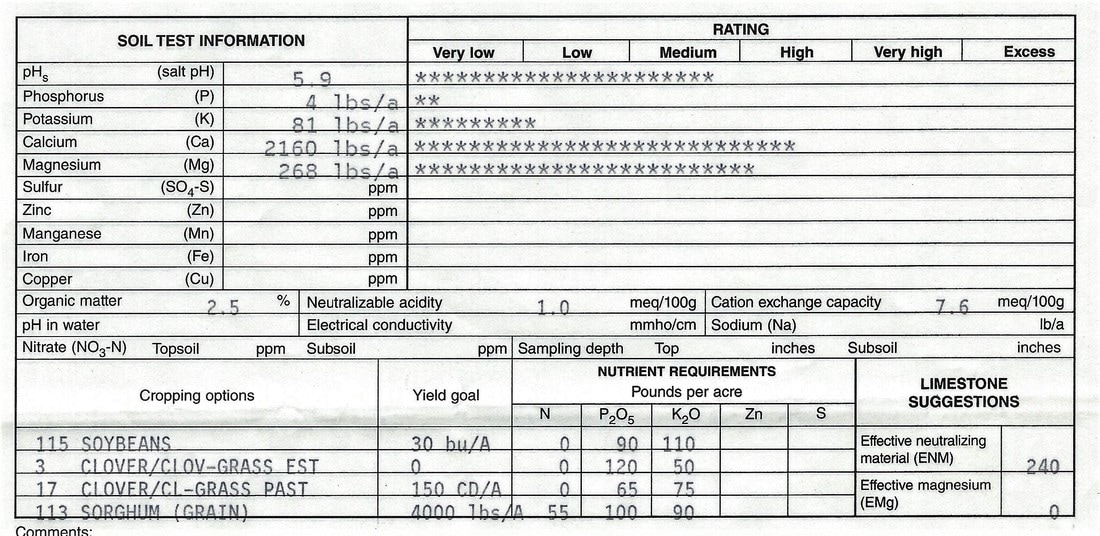
2008 Soil Test Results

2017 Soil Test Results
868 lbs Applied of mix with 0-46-0 and 0-0-60
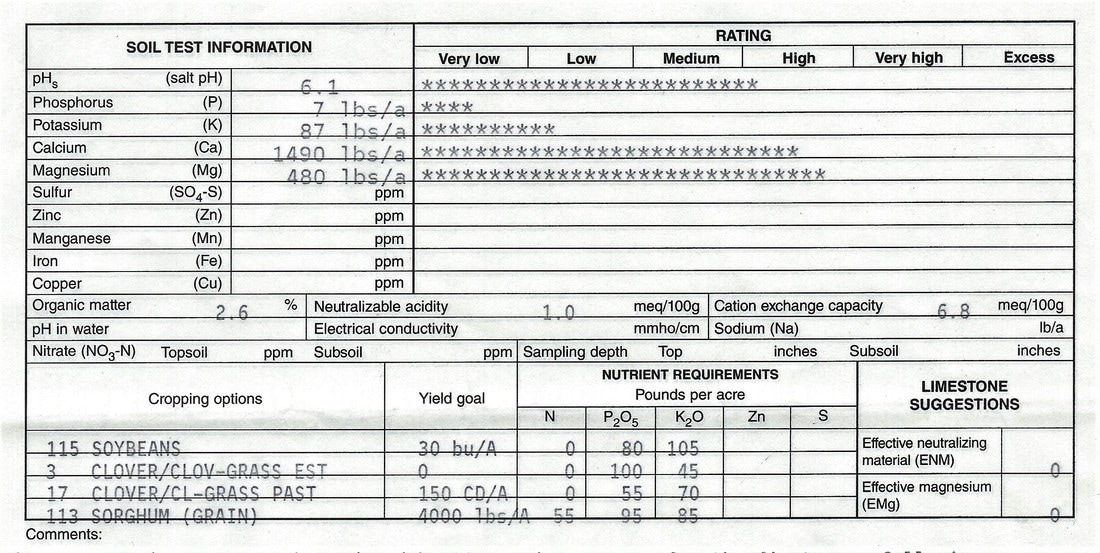
Saddle Food Plot
2008 Soil Test Results
2017 Soil Test Results

576 lbs Applied of mix with 0-46-0 and 0-0-60
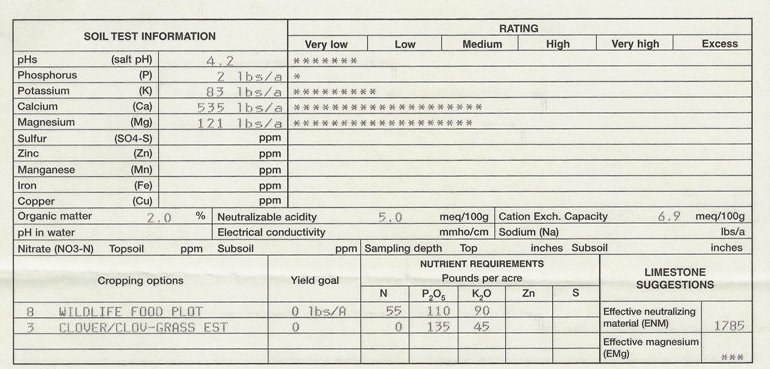
Watering Hole Food Plot
2008 Soil Test Results
2017 Soil Test Results
288 lbs Applied of mix with 0-46-0 and 0-0-60
Bottoms Food Plot
2008 Soil Test Results
2017 Soil Test Results
288 lbs Appliedof mix with 0-46-0 and 0-0-60
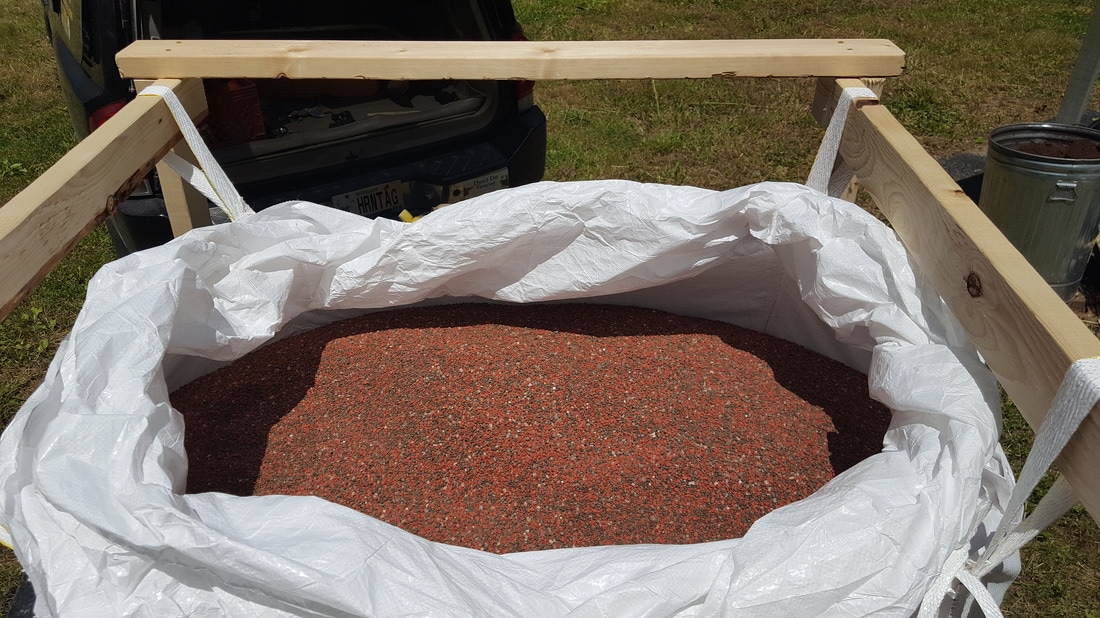
Me and the 7 buckets brigade empty 2020 lbs of mixed fertilizer from super sacks and spread in 5 hours. Even had a few na sayer at the fertilizer plant didn't figure they could fill the super sacks and get them on my trailer. Ha ha worked like a charm. Try that snowflakes.
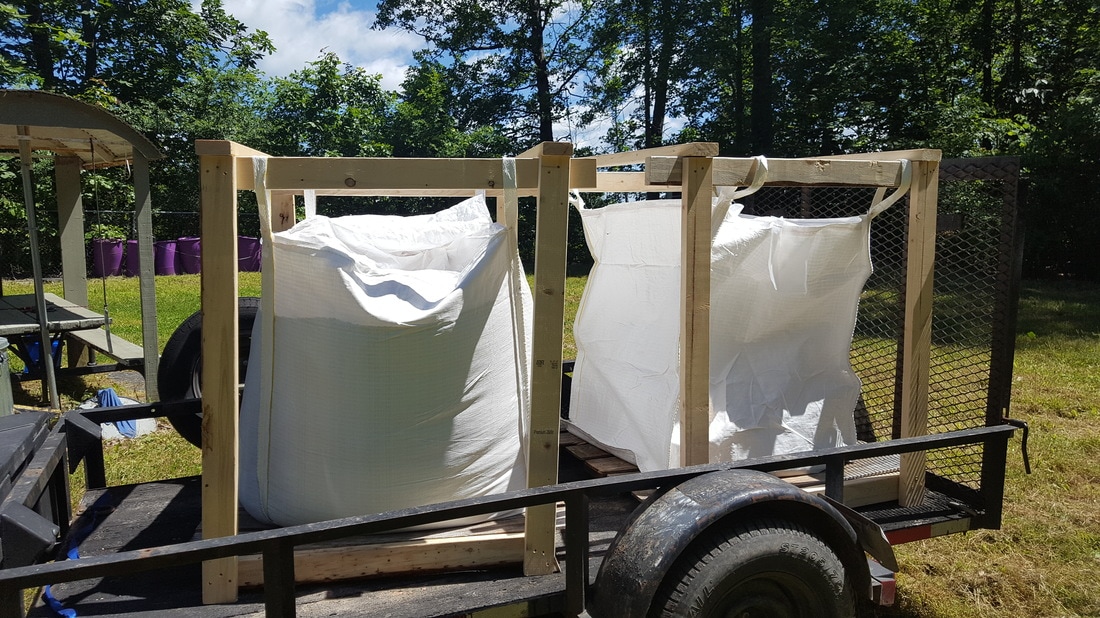
1160 lbs of 0-46-0 and 860 lbs of 0-0-60 by doing it this way I saved around estimated 488 dollars
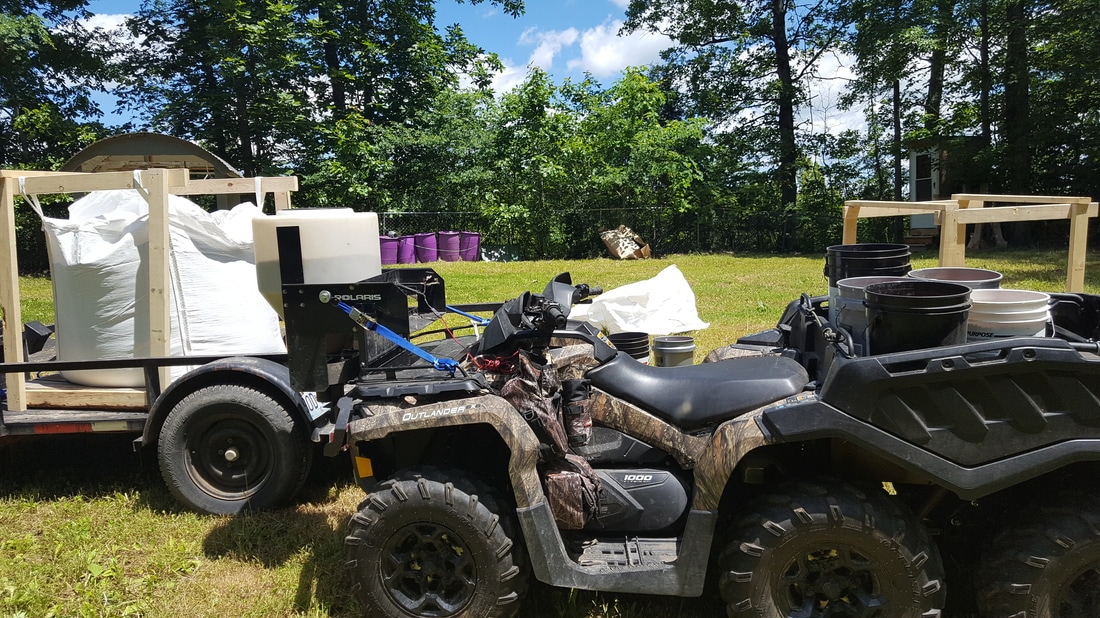
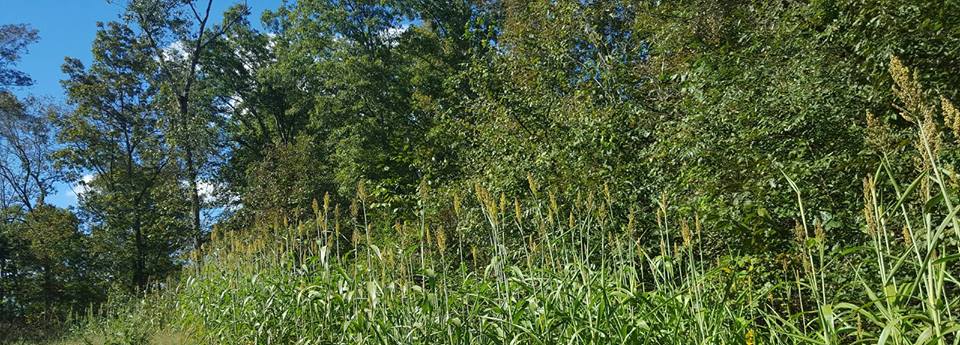
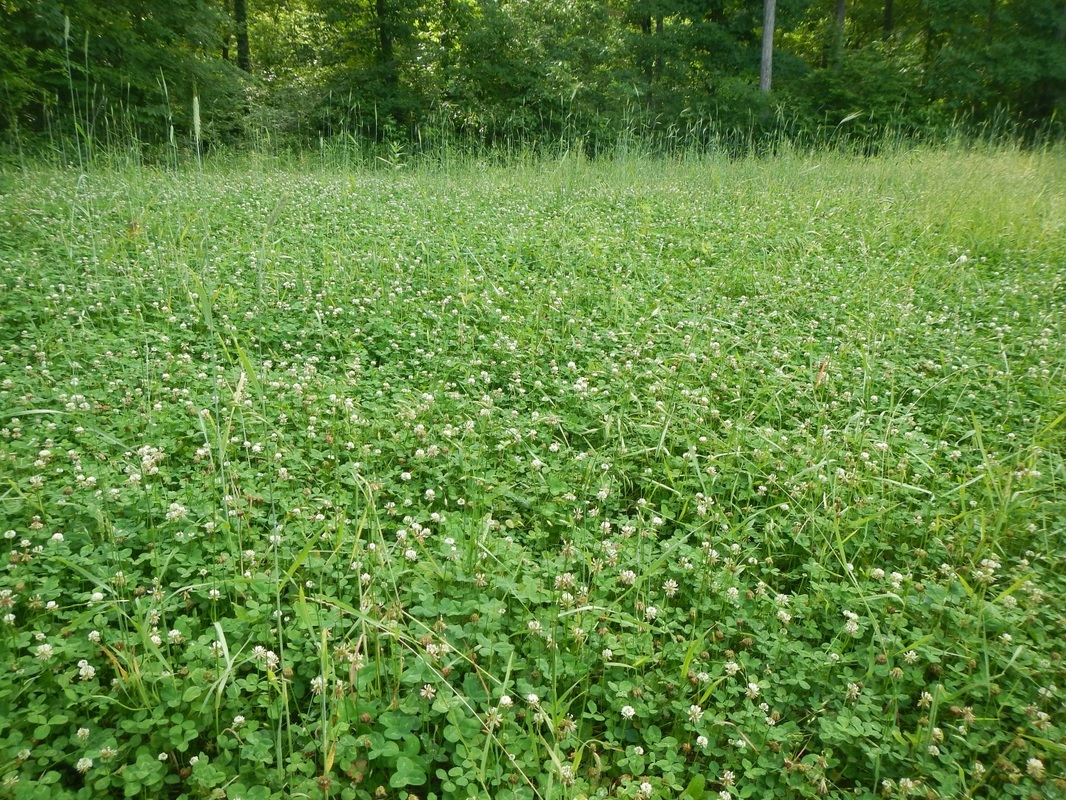
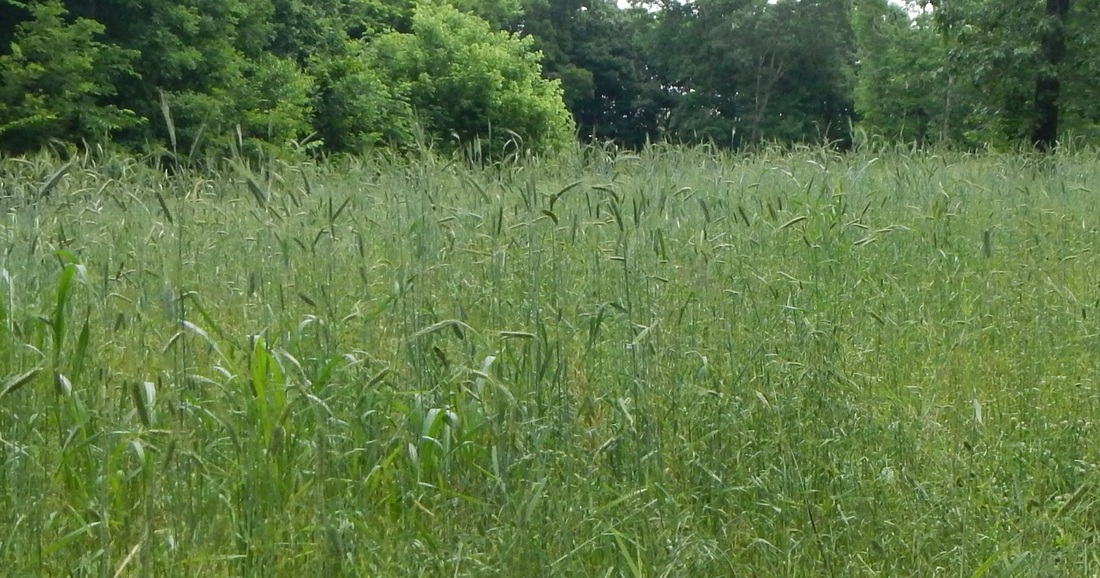
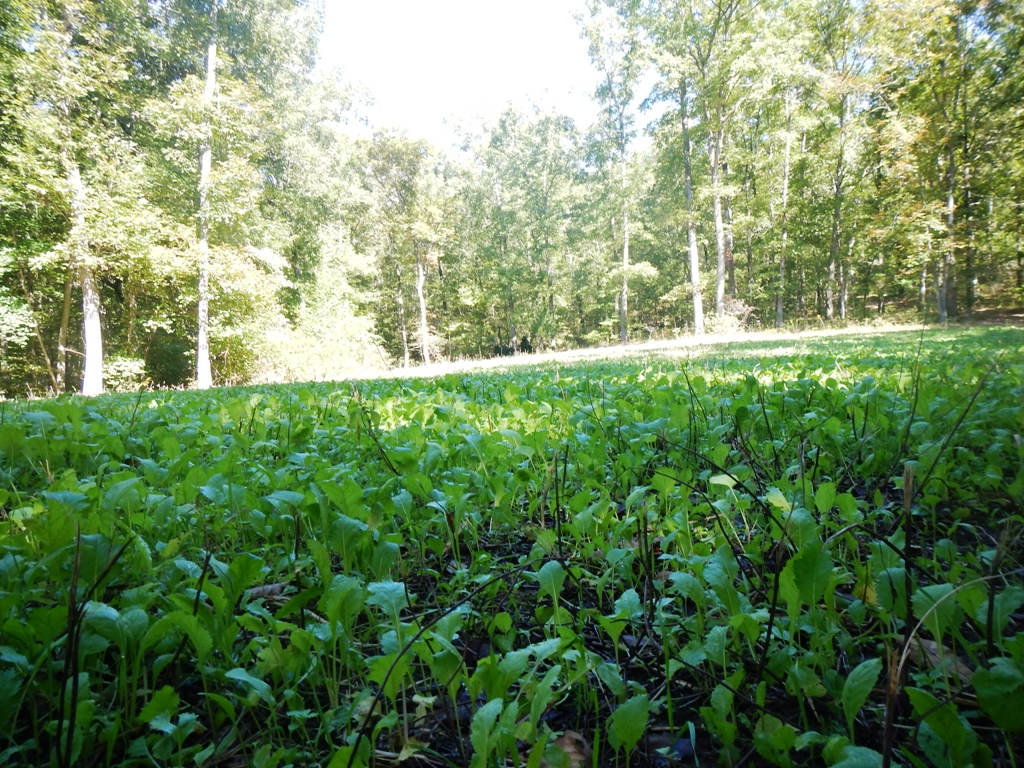
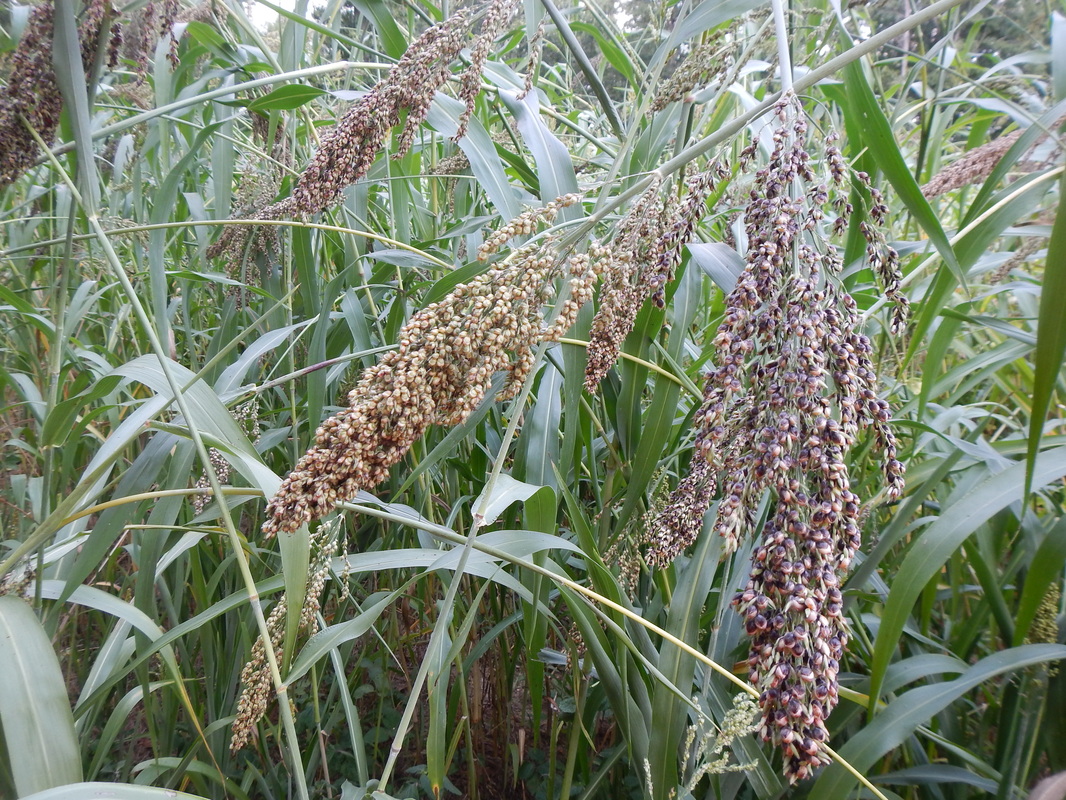
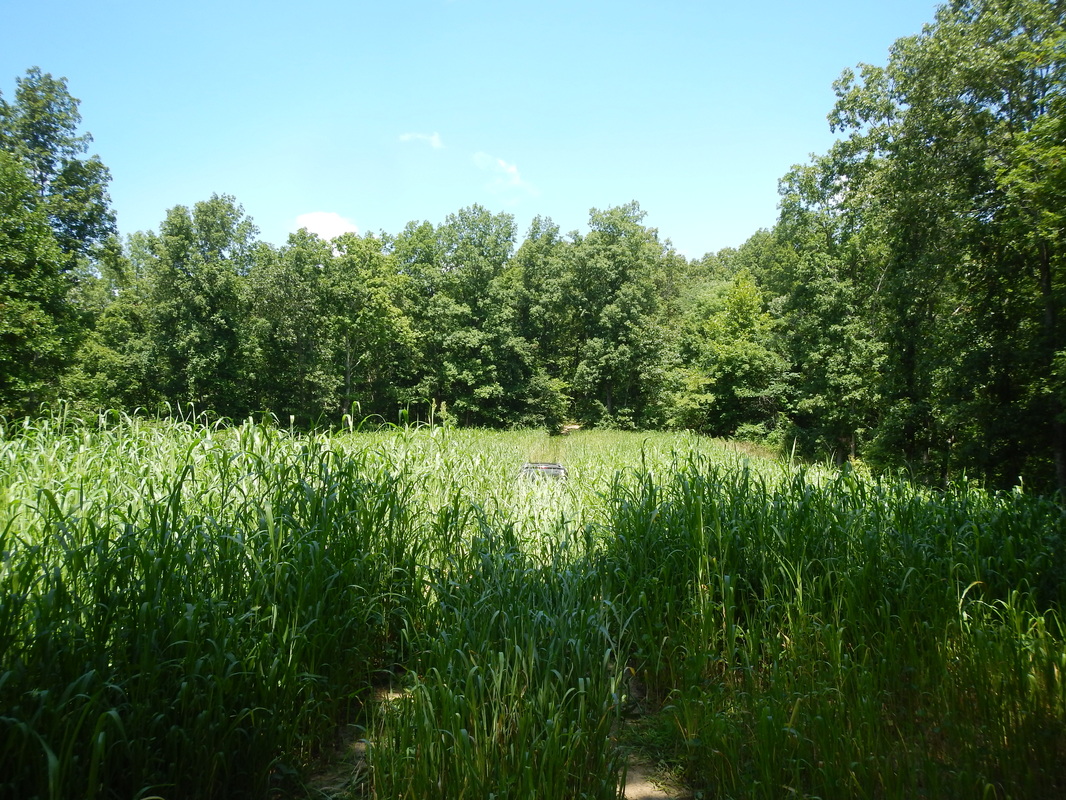
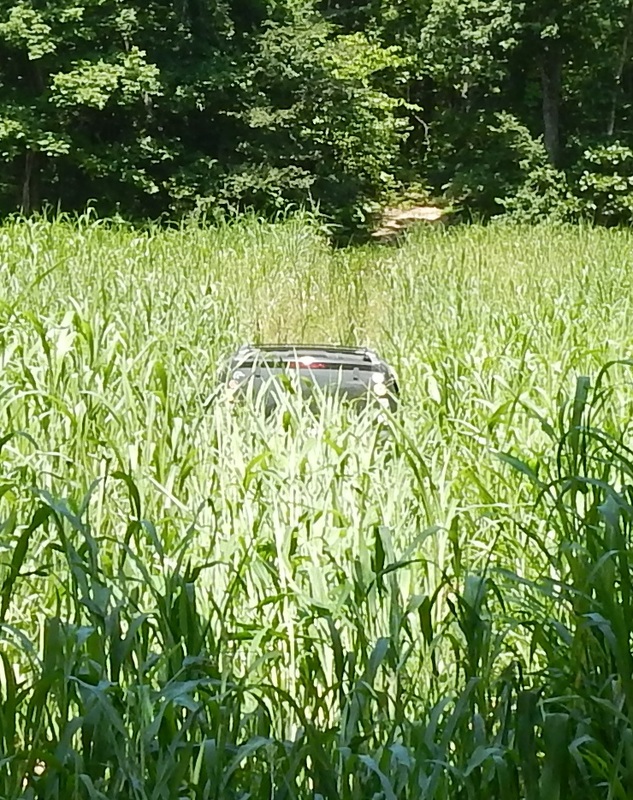
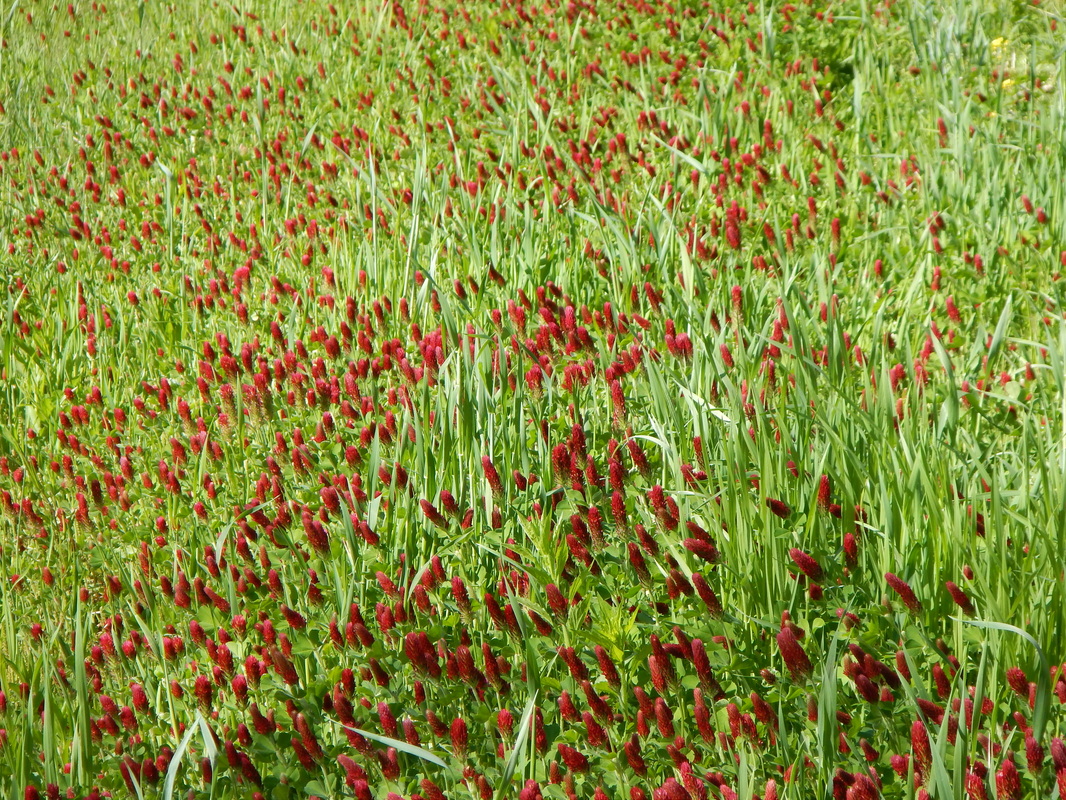
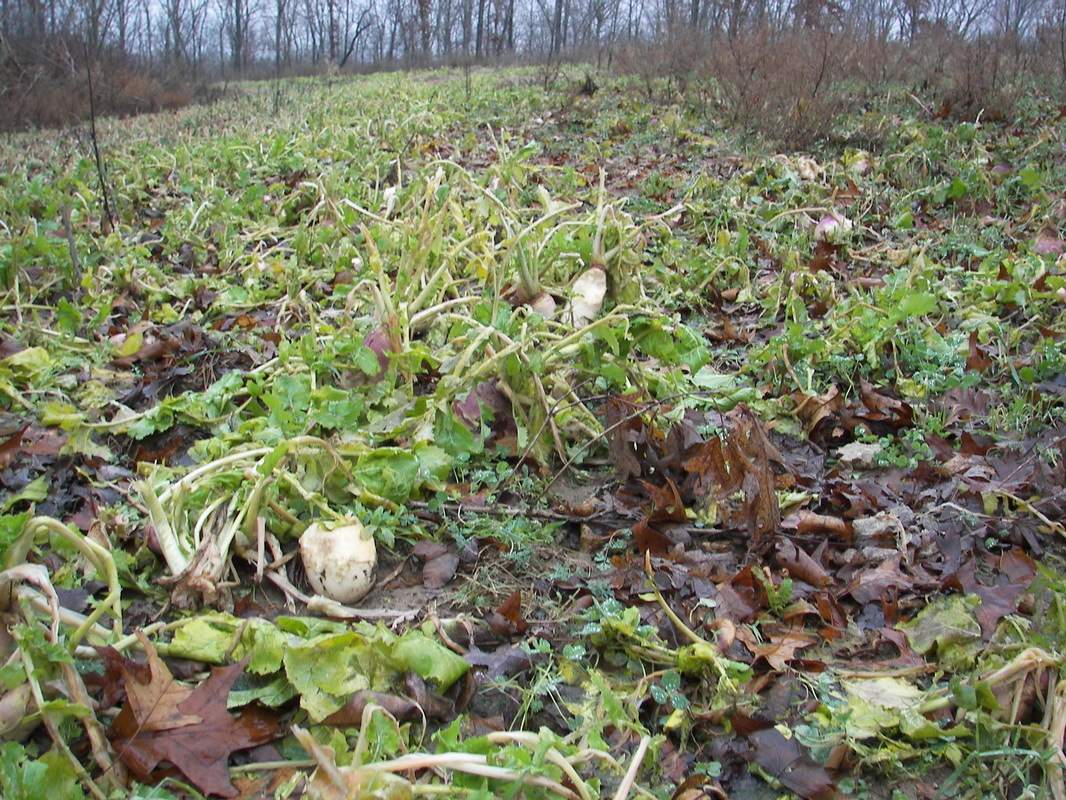
Two different Soil Coverage examples


Reason I apply fertilizer after broadcasting seed I use this method as additional cultipacking of seed with the tires on the ATV
This makes the 5th Soil Sample over time.
Main Food Plot
2008 Soil Test Results
2017 Soil Test Results
868 lbs Applied of mix with 0-46-0 and 0-0-60
Saddle Food Plot
2008 Soil Test Results
2017 Soil Test Results
576 lbs Applied of mix with 0-46-0 and 0-0-60
Watering Hole Food Plot
2008 Soil Test Results
2017 Soil Test Results
288 lbs Applied of mix with 0-46-0 and 0-0-60
Bottoms Food Plot
2008 Soil Test Results
2017 Soil Test Results
288 lbs Appliedof mix with 0-46-0 and 0-0-60
Me and the 7 buckets brigade empty 2020 lbs of mixed fertilizer from super sacks and spread in 5 hours. Even had a few na sayer at the fertilizer plant didn't figure they could fill the super sacks and get them on my trailer. Ha ha worked like a charm. Try that snowflakes.
1160 lbs of 0-46-0 and 860 lbs of 0-0-60 by doing it this way I saved around estimated 488 dollars
Two different Soil Coverage examples
Reason I apply fertilizer after broadcasting seed I use this method as additional cultipacking of seed with the tires on the ATV
Last edited: