Soil result before and after also Fertilizer on the Ground

horntagger

Member
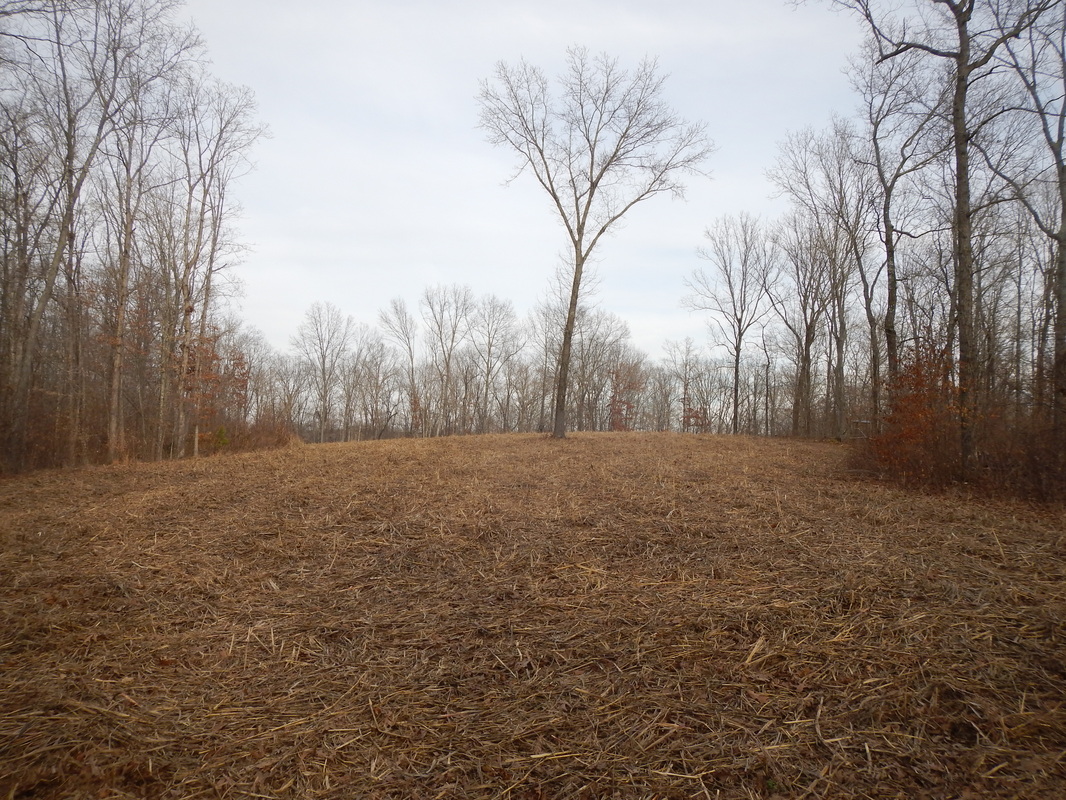
2008 Doze Ground from Oak/Hickory Forest

This makes the 5th Soil Sample over time.

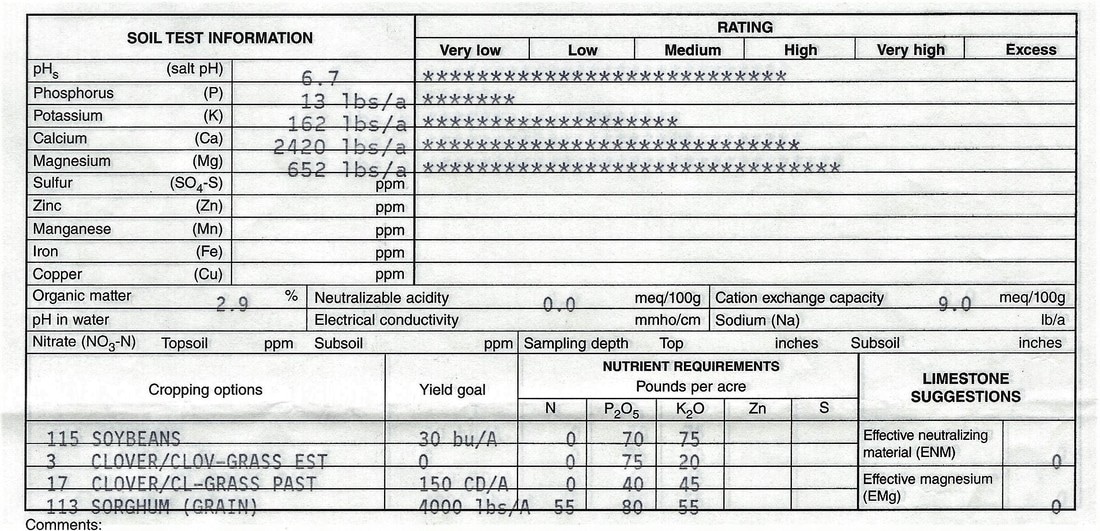
Main Food Plot
2008 Soil Test Results
7477495_orig.jpg

2017 Soil Test Results
main-copy_orig.jpg

868 lbs Applied of mix with 0-46-0 and 0-0-60

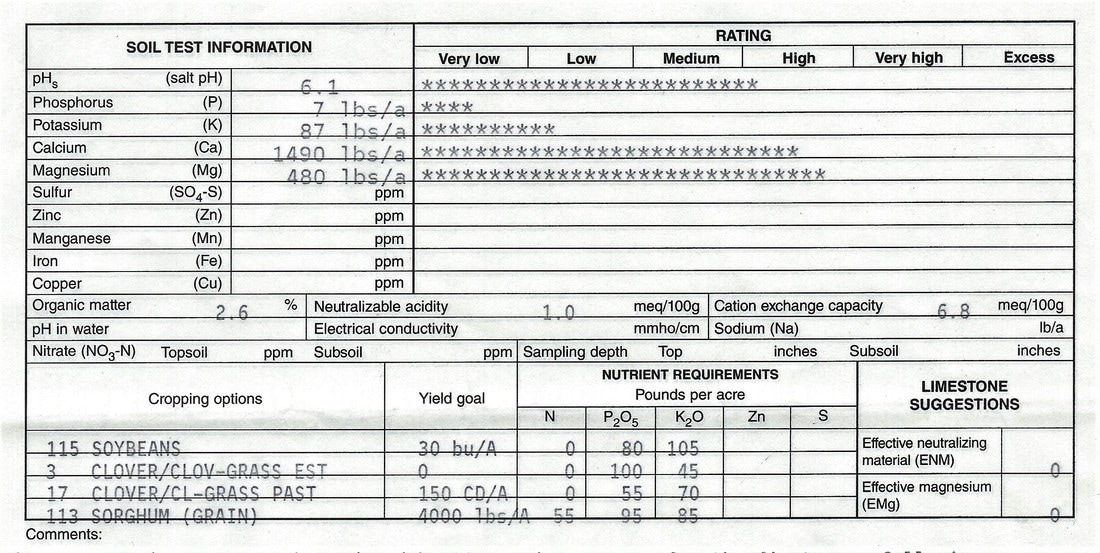
Saddle Food Plot
2008 Soil Test Results
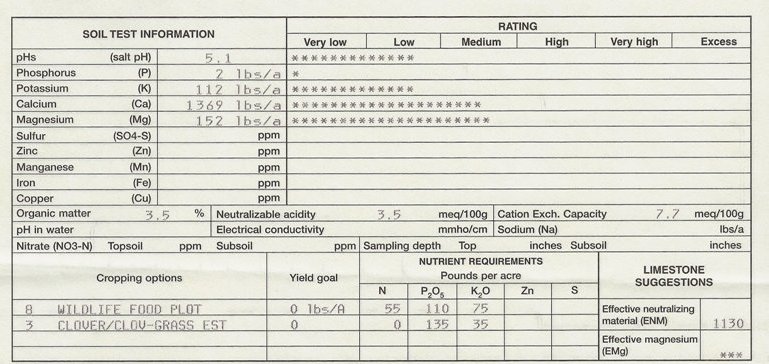
8274322_orig.jpg

2017 Soil Test Results
saddle-copy_orig.jpg

576 lbs Applied of mix with 0-46-0 and 0-0-60


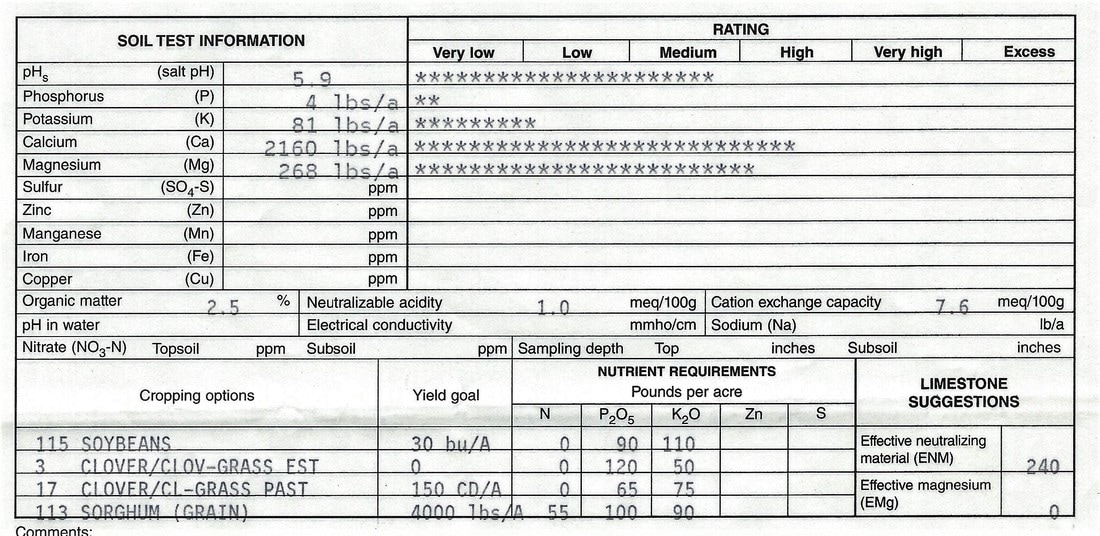
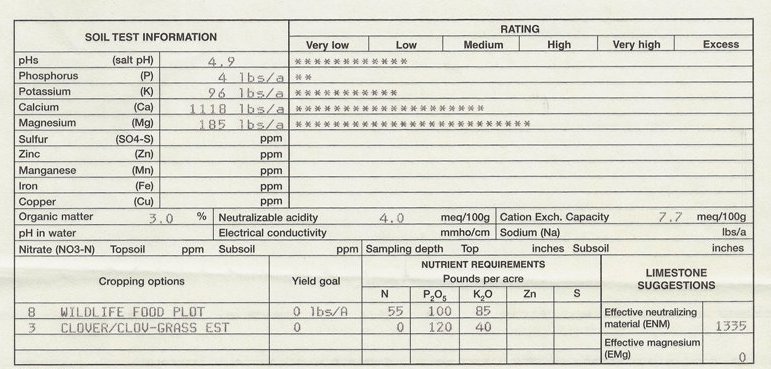
Watering Hole Food Plot
2008 Soil Test Results
7836777_orig.jpg

2017 Soil Test Results
waterhole-copy_orig.jpg

288 lbs Applied of mix with 0-46-0 and 0-0-60


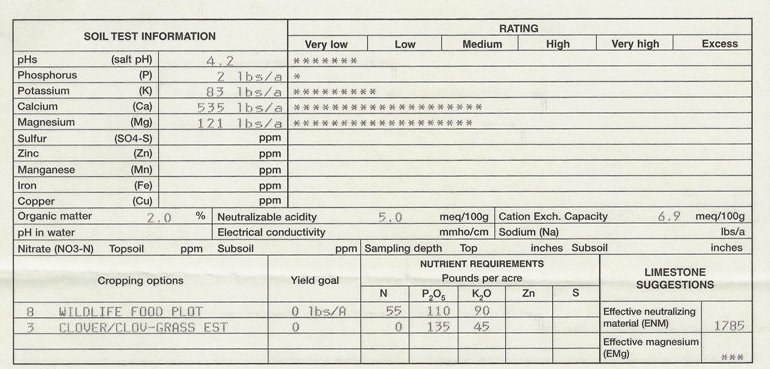
Bottoms Food Plot
2008 Soil Test Results
6936188_orig.jpg

2017 Soil Test Results
bottoms-copy_orig.jpg

288 lbs Appliedof mix with 0-46-0 and 0-0-60

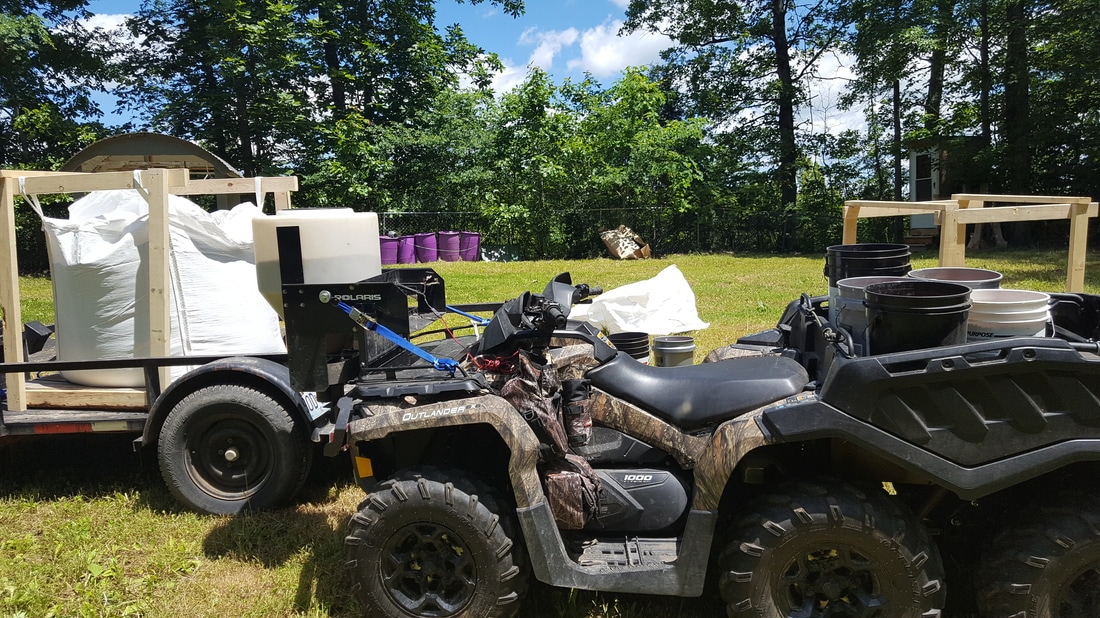
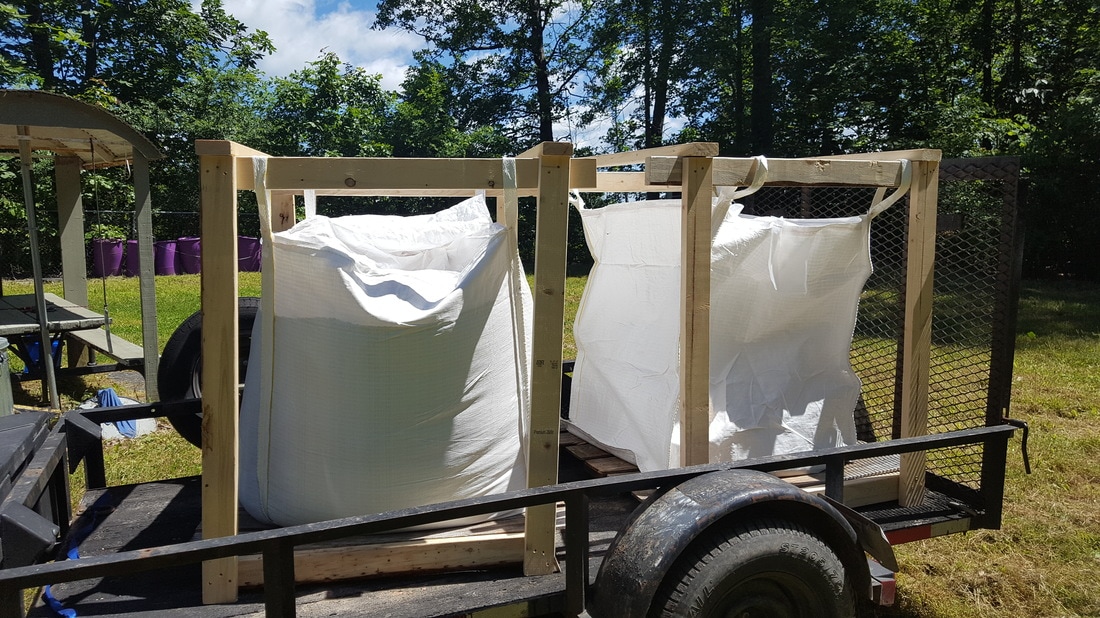
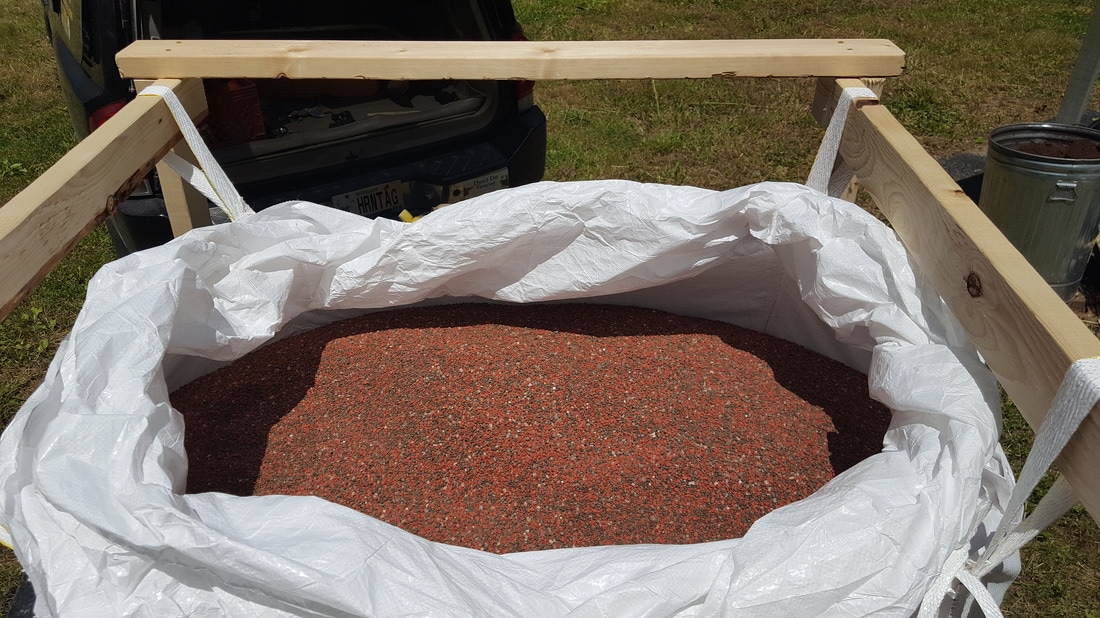
Me and the 7 buckets brigade empty 2020 lbs of mixed fertilizer from super sacks and spread in 5 hours. Even had a few na sayer at the fertilizer plant didn't figure they could fill the super sacks and get them on my trailer. Ha ha worked like a charm. Try that snowflakes.
20170525-110901_orig.jpg


1160 lbs of 0-46-0 and 860 lbs of 0-0-60 by doing it this way I saved around estimated 488 dollars
20170525-113457_orig.jpg


20170525-115748_orig.jpg


Two different Soil Coverage examples
20170525-133016-copy-copy_orig.jpg


20170525-133019-copy_orig.jpg


Reason I apply fertilizer after broadcasting seed I use this method as additional cultipacking of seed with the tires on the ATV
 
Last edited:
Good job increasing the pH and some of the nutrient levels, but I would be taking a hard look at your tillage methods. You've lost OM and have a lower CEC on most of your fields. From an overall health of the soil perspective, these are going in the wrong direction. :(
 
Good job increasing the pH and some of the nutrient levels, but I would be taking a hard look at your tillage methods. You've lost OM and have a lower CEC on most of your fields. From an overall health of the soil perspective, these are going in the wrong direction. :(
Don't disk much because don't have tractor and too rocky we break disk every time, but friends brings his every now an then especially after planting jungle plots so if I had to guess maybe 4 to 5 times.
Doing Main Food Plot only for comparison.
2008 - OM 3.9 - CEC - 9.6
2009 - OM 3.2 - CEC - 8.2
2012 - OM 4.1 - CEC - 11.4
2015 - OM 3.3 - CEC - 10.4
2017 - OM 2.9 - CEC - 9.0
 
Did you ever put on any phosphorus?
Yes but not every year depends on money tough to keep it up.
Here is comparison for main food plot over time using number system
2008 - 12 - Low
2009 - 14 - Low
2012 - 19 - Medium
2015 - 17 - Low
2017 - 7 - Low
 
Horntagger, just thought Id throw this out there for a bit of food for thought.

Don't get to wrapped up in the low, low, Medium, low, low aspect. Those are just the category/naming that the soil sample company uses to correlate one piece of ground to another across the region that they supply. Could be anywhere from statewide to multi-state depending on region. So it gives a false sense on true averages.

P works in PPM, so it takes roughly 30lbs actual phos applied to raise your soil test level 1 part per mil. say 13 to 14.
It also requires a decent tonnage to be removed, say 20t of corn silage to remove 2 ppm.
I highly doubt our food plots see this rate of use in a single growing season.

14 phos is where one likes to see there baseline but anything above 10 is good.

Soil testing can be a very inaccurate way to measure our soils health, See year 15-17.
No chance you went from a 17 to a 7 in 2 growing seasons. That would not even be possible if you where growing 240 bu corn

How one takes the sample from the location can make a world of difference.
Repeatability is almost impossible. I bet if you would take two samples from the same field. You will get 2 completely different sets of data.

What they do provide is a good baseline analysis of soil health, with soil OM an pH being the primaries to focus on.
 
I agree completely TrampledbyTurtle going to call you TBT your name is hard to type. LOL - Well have busted my butt off this week and I am glad - I am currently getting a good rain as I type - Another rain called for Saturday and great rain called for on Sunday. Bring it on.

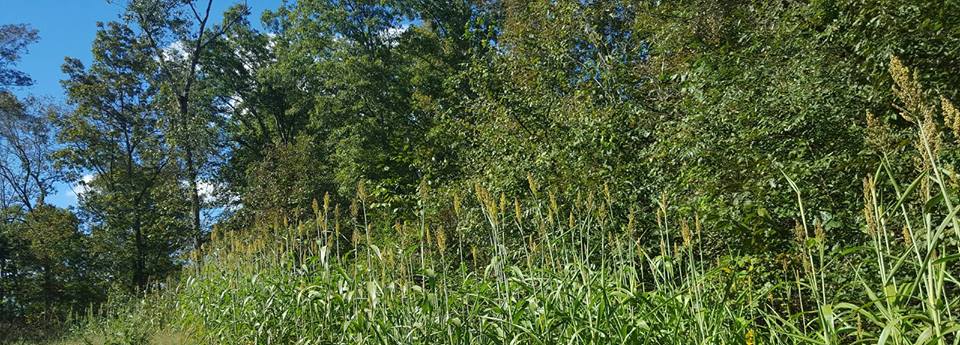
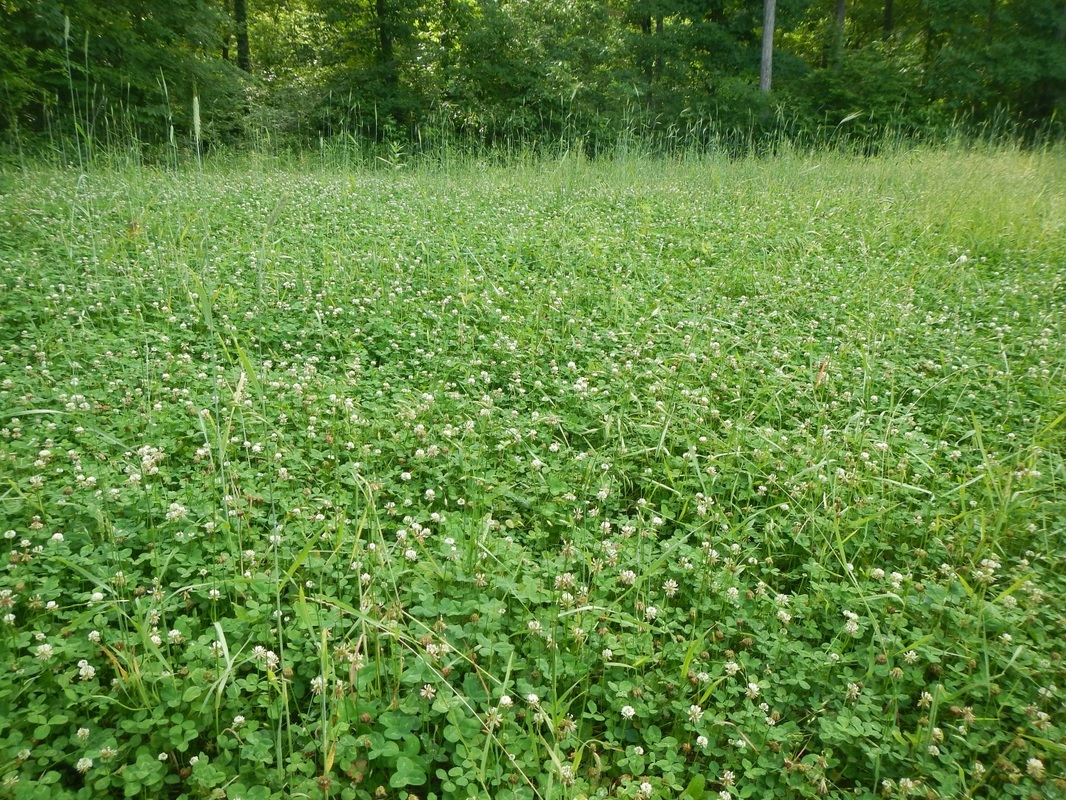
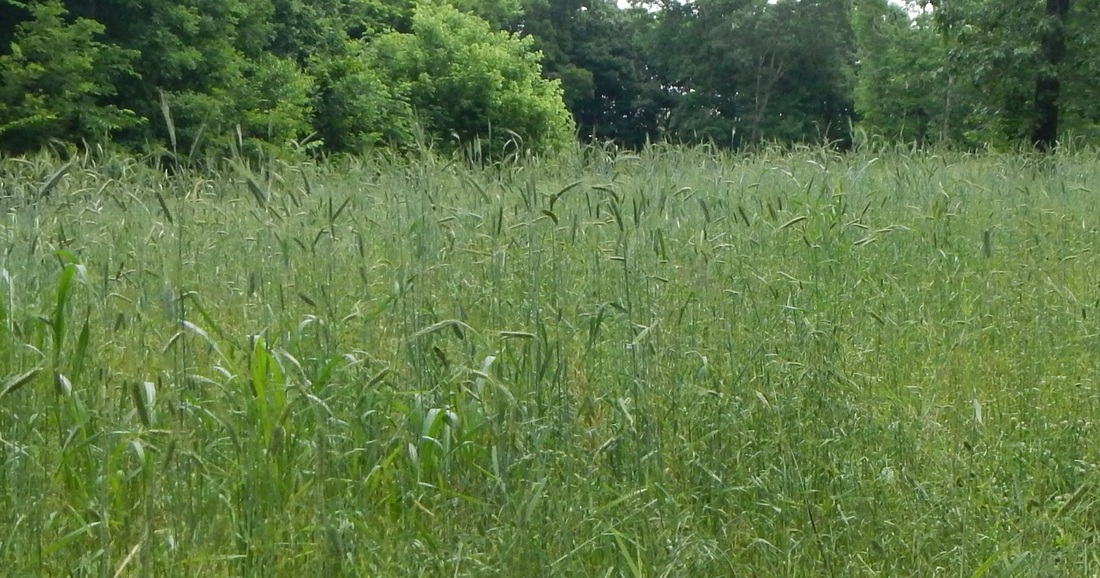
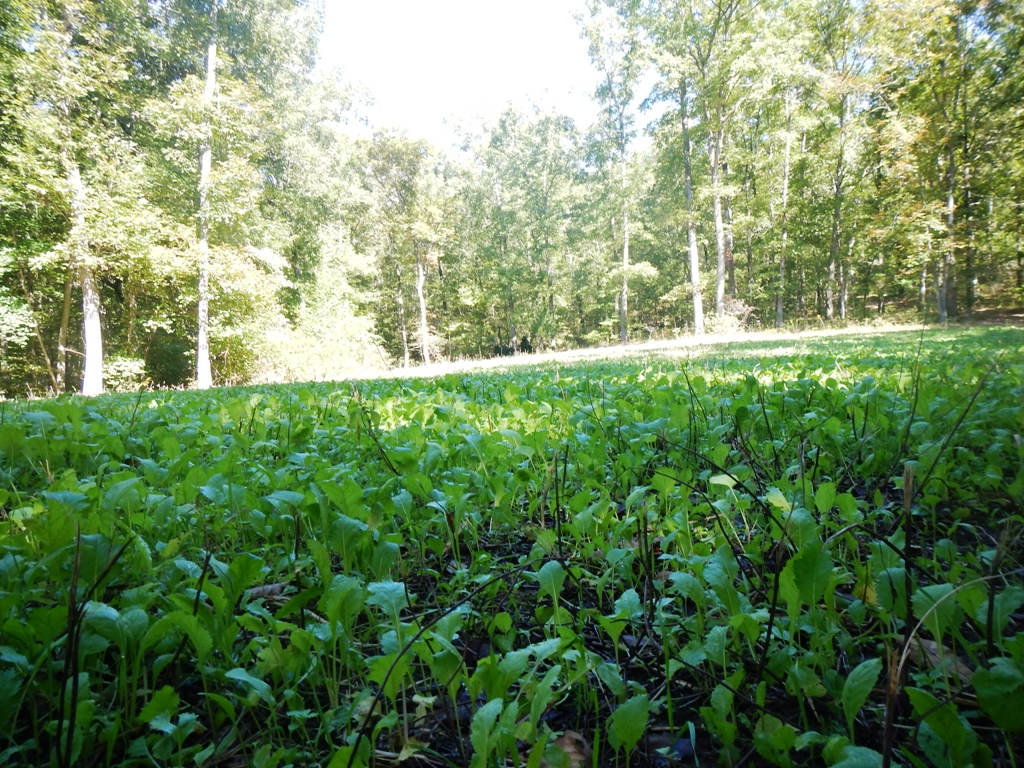
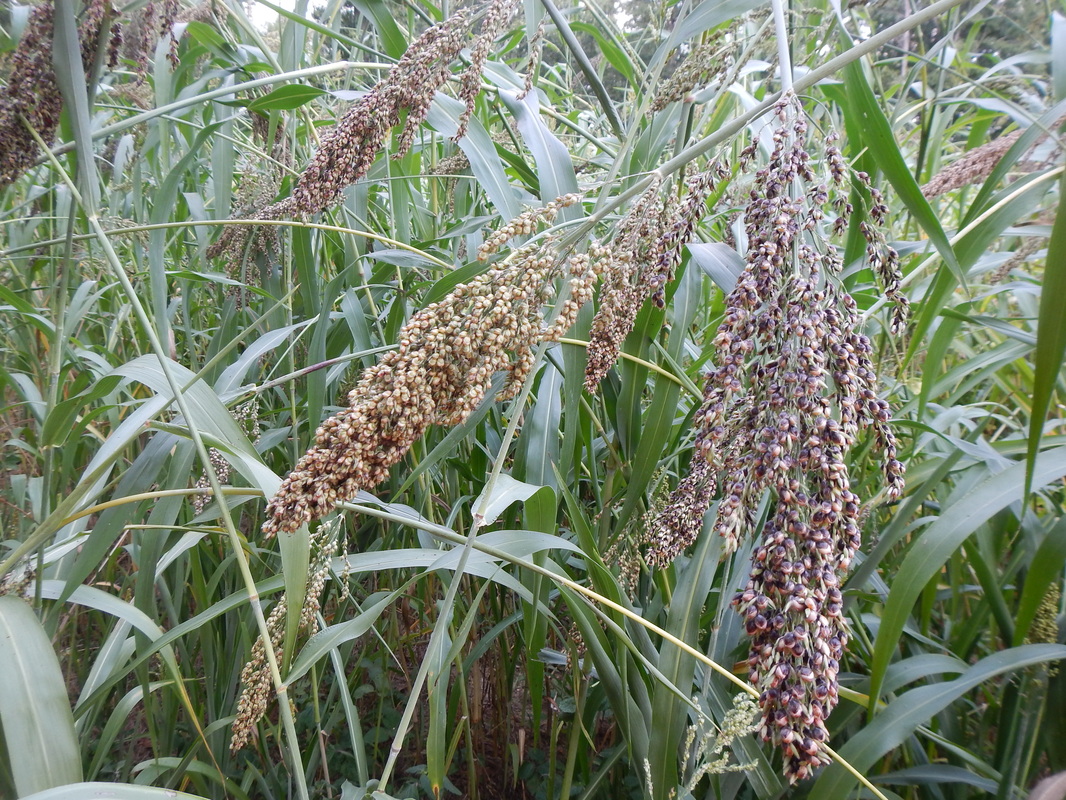
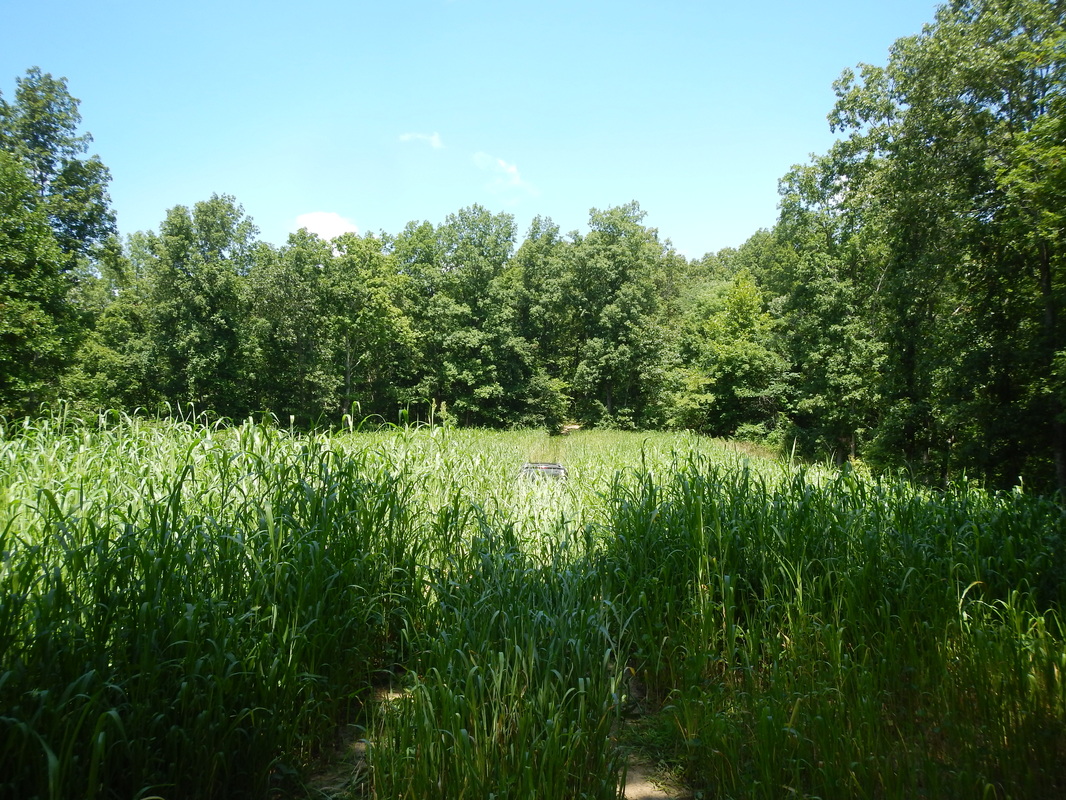
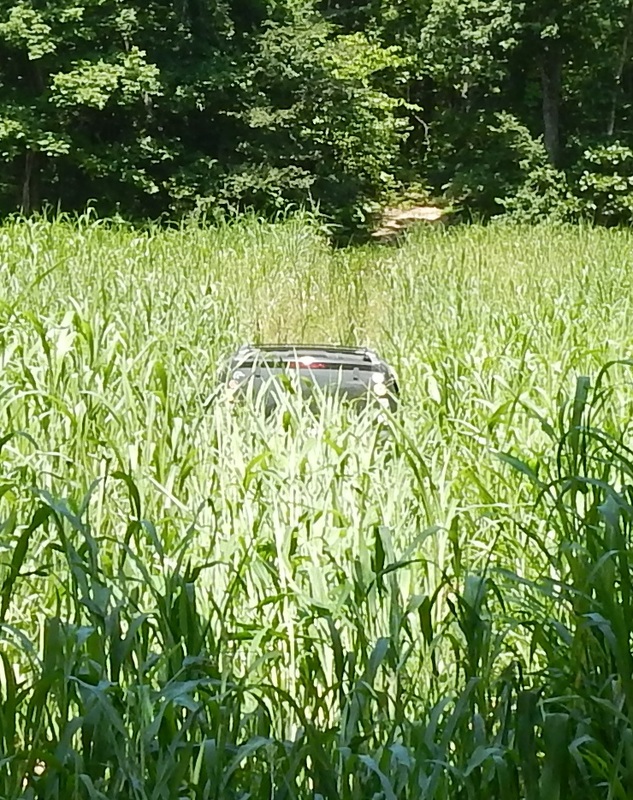
Here are some of the different food plots working backwards. So I have also a hard time believe that I am loosing organic matter and CEC has drop that much. But that's my opinion.

2016

14520352-617831351754668-2612129585652256533-n_orig.jpg


484251_orig.jpg


8571361_orig.jpg


2015

734272_orig.jpg


6290627_orig.jpg


4989220_orig.jpg


2014

9226715_orig.jpg


3698414_orig.jpg


5969485_orig.jpg


2013
6216170_orig.jpg


4431064_orig.jpg


2012
2769713_orig.jpg


4453039_orig.jpg


2011

9549271_orig.jpg
 
I hope you don’t take offense to my post because it’s not my intent but I agree with Jason on this one. I think a lot of what is carrying your plot is likely it being a good mix of sand/silt/clay…..The clay content is likely giving you some nutrient holding capacity. I do think however that you’re limiting its potential by keeping all of the organic matter burnt up. You can look at the numbers on the soil test and see that. If you were building organic matter then you would have seen a significant increase over that period of time. You’re either remaining static or going backwards. That’s due to tillage. You could hold at least twice the amount of Ca you’re holding now with more organic matter in the soil. I don’t say that to try and diminish your results….but to present to you the possibility that your field might even have more potential than what you’re giving it credit for. Not only the potential for better plant growth but the potential for more efficient use of inputs....less $$$ spent...buffer against stress periods.... etc....
 
Last edited:
All sounds good CNC. Here is what I am dealing with for all my food plots.

73157—Captina silt loam, 3 to 8 percent slopes Setting (fig. 9) Landform: Ridges Position on the landform: Summits Parent material: Loess over loamy colluvium and residuum derived from dolostone Composition Captina and similar soils—90 percent Minor components—10 percent • Scholten • Clarksville • Very deep, fine-silty soilsPosition on the landform: Backslopes Parent material: Coulstone—gravelly colluvium derived from sandstone; Bender—residuum from sandstone Composition Coulstone and similar soils—40 percent Bender and similar soils—25 percent Minor components—35 percent • Clarksville • Scholten • Rock outcrop Typical Profile Coulstone Oe—0 to 1 inch; moderately decomposed plant material A—1 to 6 inches; extremely cobbly sandy loam Bt1—6 to 29 inches; extremely cobbly sandy loam 2Bt2—29 to 42 inches; extremely stony sandy loam 3Bt3—42 to 80 inches; extremely stony clay loam Bender Oe—0 to 1 inch; moderately decomposed plant material A—1 to 5 inches; extremely cobbly sandy loam Bt1—5 to 21 inches; extremely cobbly sandy loam Bt2—21 to 31 inches; extremely stony sandy loam 2R—31 to 80 inches; bedrock Soil Properties and Qualities Depth to bedrock: Coulstone—very deep (more than 60 inches); Bender—moderately deep (20 to 40 inches) Drainage class: Somewhat excessively drained Permeability: Moderately rapid (2 to 6 inches per hour) Available water capacity:Very low (0 to 3 inches) Shrink-swell potential: Low (0 to 3 percent) Flooding: None Depth to water table: More than 6 feet

73139—Poynor-ClarksvilleScholten complex, 8 to 15 percent slopes, stony Setting Landform: Ridges Position on the landform: Summits Parent material: Poynor—gravelly colluvium over clayey residuum from cherty dolostone; Clarksville—gravelly colluvium derived from cherty dolostone; Scholten—gravelly colluvium derived from cherty dolostone Composition Poynor and similar soils—35 percent Clarksville and similar soils—32 percent Scholten and similar soils—15 percent Minor components—18 percent • Very deep, fine-loamy soils • Yelton • Very deep, clayey-skeletal or clayey soils • Bender Typical Profile Poynor Oi—0 to 1 inch; slightly decomposed plant material A—1 to 4 inches; gravelly silt loam E—4 to 13 inches; very gravelly silt loam Bt1—13 to 24 inches; extremely gravelly silt loam 2Bt2—24 to 80 inches; clay Clarksville Oi—0 to 1 inch; slightly decomposed plant material A—1 to 5 inches; gravelly silt loam E—5 to 8 inches; gravelly silt loam Bt1—8 to 18 inches; very gravelly loam 2Bt2—18 to 42 inches; very gravelly loam 3Bt3—42 to 65 inches; clay Scholten Oi—0 to 1 inch; slightly decomposed plant material A—1 to 3 inches; gravelly silt loam E—3 to 8 inches; gravelly silt loam 28 Soil Survey Bt—8 to 17 inches; very gravelly silty clay loam 2Btx—17 to 41 inches; very gravelly silt loam 3Bt—41 to 80 inches; gravelly clay Soil Properties and Qualities Depth to bedrock: Very deep (more than 60 inches) Drainage class: Poynor—well drained; Clarksville— somewhat excessively drained; Scholten— moderately well drained Permeability: Poynor—moderate (0.6 inch to 2 inches per hour); Clarksville—moderate (0.6 inch to 2 inches per hour); Scholten—moderate (0.6 inch to 2 inches per hour) over very slow (less than 0.06 inch per hour) Available water capacity: Poynor—low (3 to 6 inches); Clarksville—low (3 to 6 inches); Scholten—very low (0 to 3 inches) Shrink-swell potential: Poynor—moderate (3 to 6 percent); Clarksville—low (0 to 3 percent); Scholten—moderate (3 to 6 percent) Flooding: None Depth to water table: Poynor—more than 6 feet; Clarksville—more than 6 feet; Scholten—12 to 29 inches
 
Back
Top