shedder
Active Member
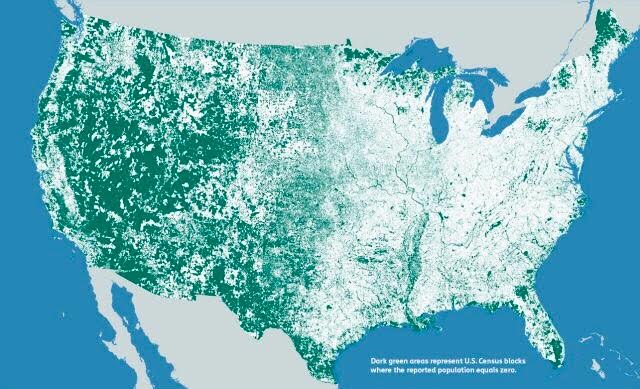
This map shows, in green where the nearly 5 million Census Blocks with zero population are located in the U.S. A Block is the smallest area unit used by the U.S. Census Bureau for tabulating statistics. As of the 2010 census, the United States consists of 11,078,300 Census Blocks. Of them, 4,871,270 blocks totaling 4.61 million square kilometers were reported to have no population living inside them. Despite having a population of more than 310 million people, 47 percent of the USA remains unoccupied. A single inhabitant is enough to omit a block from shading. This map is available as a print.
http://terriermandotcom.blogspot.ca/2017/03/nobody-lives-here.html


